- ETH/USD bounces off intraday low after stepping back from 2018 top the previous day.
- Short-term bearish chart pattern, MACD signals probe bulls.
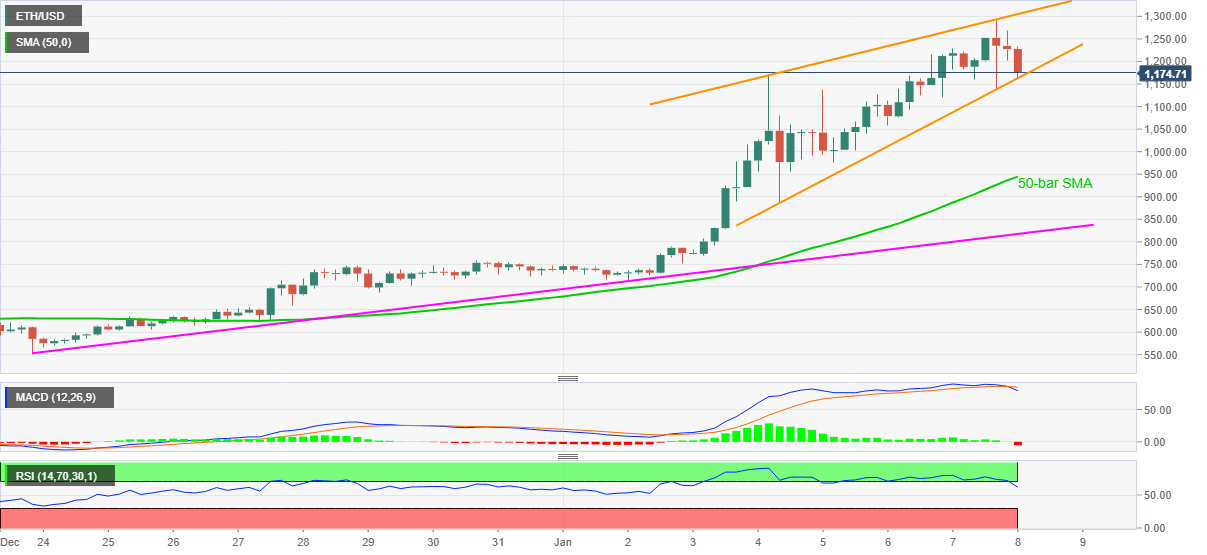
- 50-bar SMA, two-week-old support line can entertain the bears.
ETH/USD portrays a bearish chart pattern, rising wedge, following its pullback from the highest since January 2018. The quote recently bounces off an intraday low of $1,160 but remains pressured with over 3.0% losses since the start.
Other than the bearish formation, MACD also favors the short-term sellers. However, a clear downside break of $1,300 becomes necessary for the ETH/USD bear’s entry.
Following that 50-bar SMA and an upward sloping trend line from December 23, respectively around $940 and $820 can return to the charts during the Ethereum fall targeting the previous month’s low near $530.
Alternatively, $1,2.50 and the recent high near $1,300 can test intraday buyers before probing them by the resistance line of the stated rising wedge, at $1,310 now.
In a case where the ETH/USD bulls dominate past-$1,310, the year 2018 peak surrounding $1,420 will be on their radars.
To sum up, the Ethereum bulls are catching a breather and the quote can witness further consolidation of the recent gains if the short-term bearish chart pattern gets confirmed.
ETH/USD four-hour chart
Trend: Pullback expected
