- Cardano price has hit a new 2021-high at $0.529 but several indicators show it’s poised for a correction.
- The number of old-time ADA holders has dropped significantly over the past year.
- A crucial indicator has flashed several sell signals for Cardano.
Cardano had another major breakout on February 5 jumping by 21% within 12 hours and reaching a new 2021-high at $0.529. However, several metrics show that ADA is now poised for a significant correction.
Cardano price can quickly fall towards $0.43 if bulls lose this level
On the 12-hour chart, the TD Sequential indicator has just presented a sell signal and printed a green ‘8’ candlestick on the daily chart which is also usually followed by a sell signal. Both charts add a lot of selling pressure for Cardano price as the digital asset is overextended.
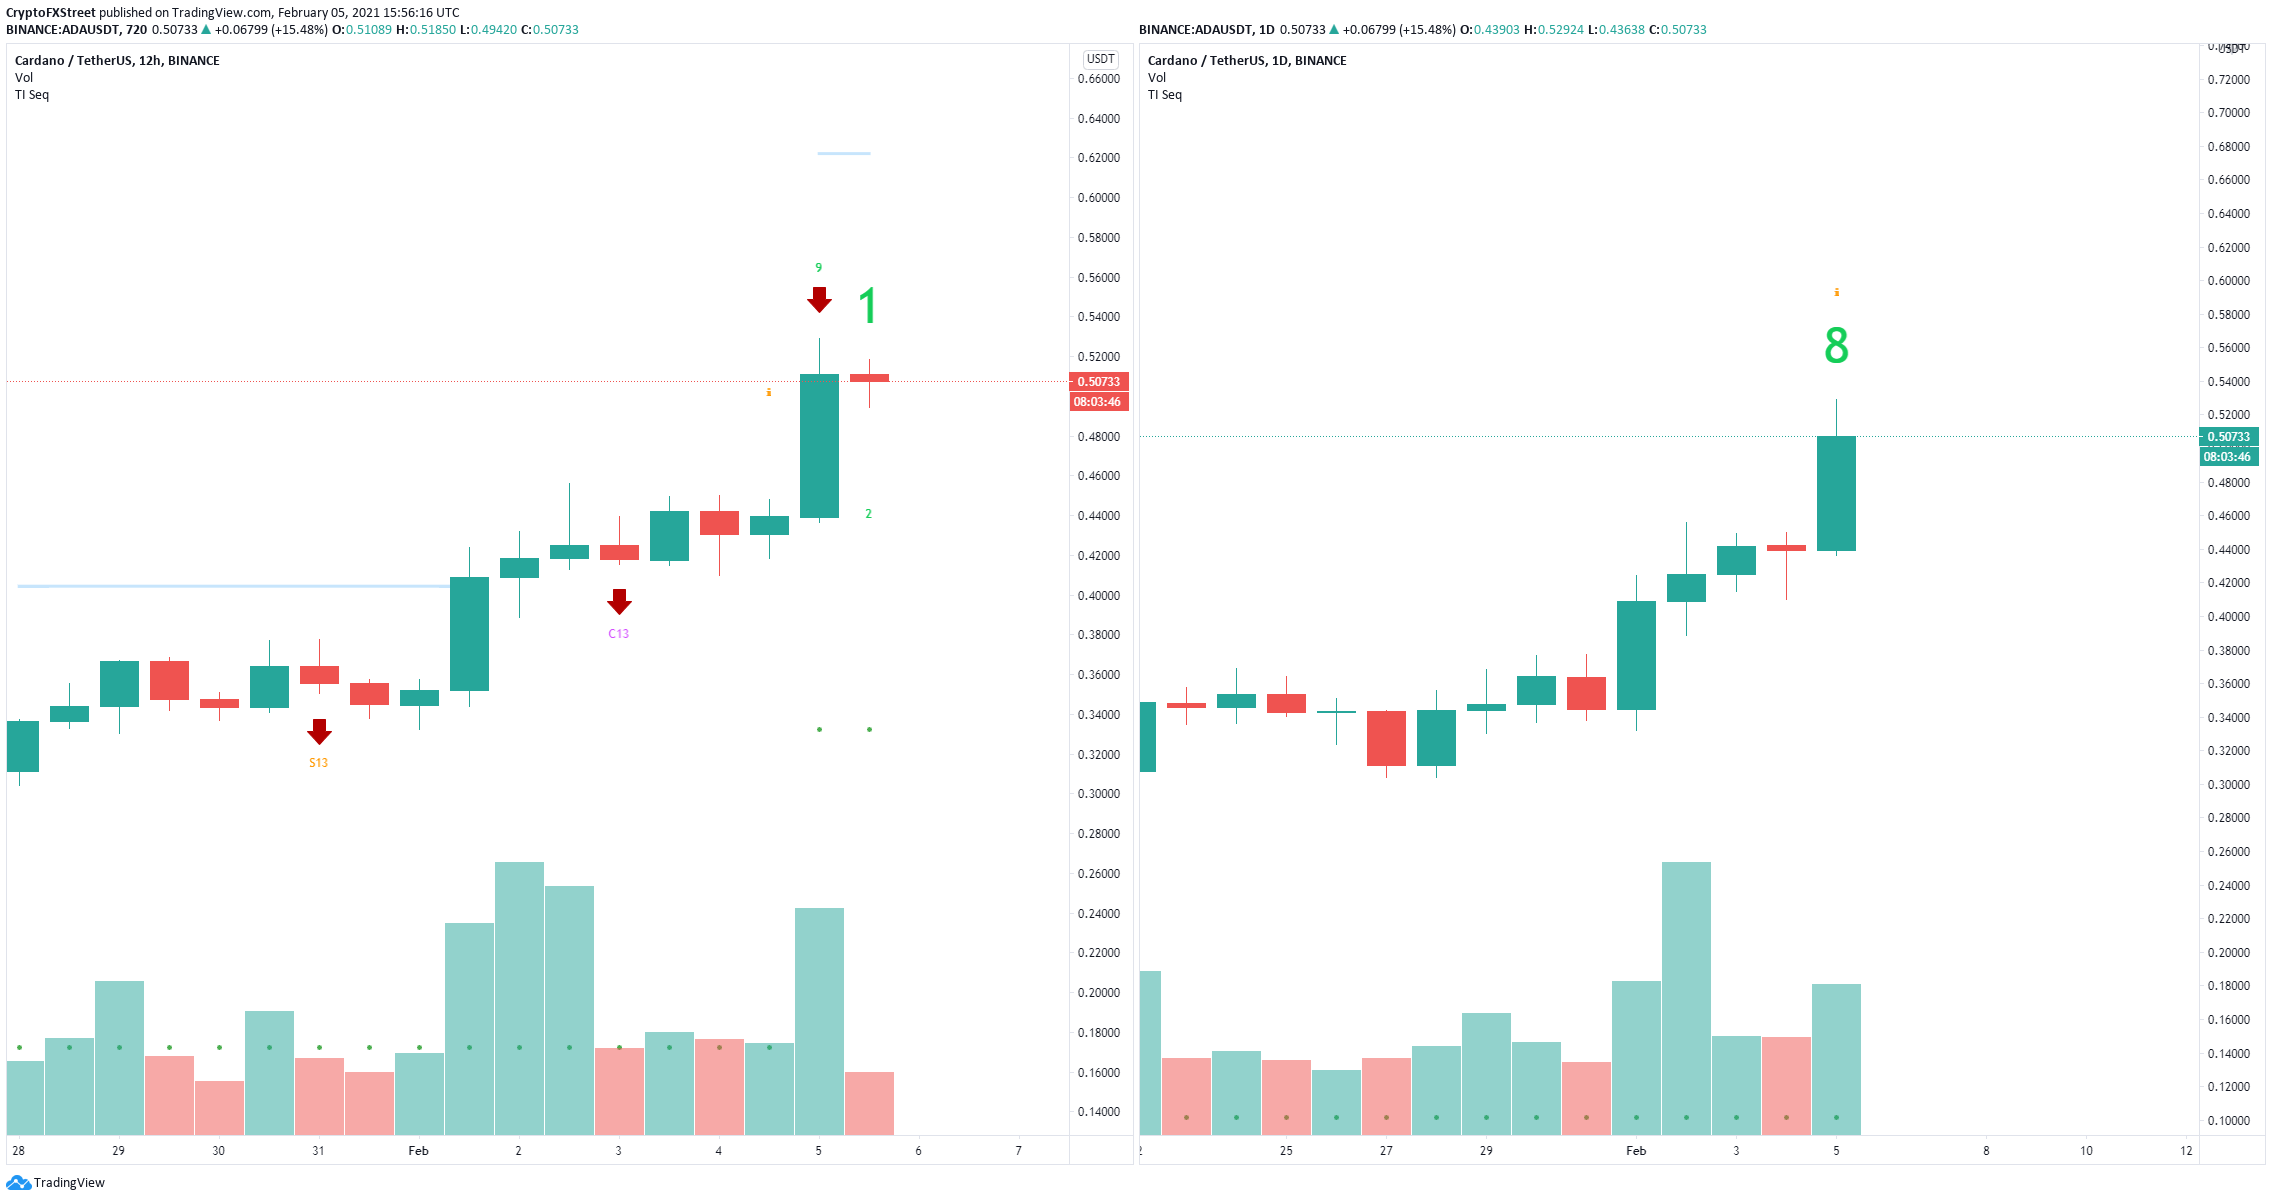
ADA Sell Signals
The In/Out of the Money Around Price (IOMAP) chart shows really weak support on the way down. The most significant area is located between $0.48 and $0.496 where 729 addresses purchased a total of 5.83 million ADA. Losing this point can easily push Cardano price down to $0.43.
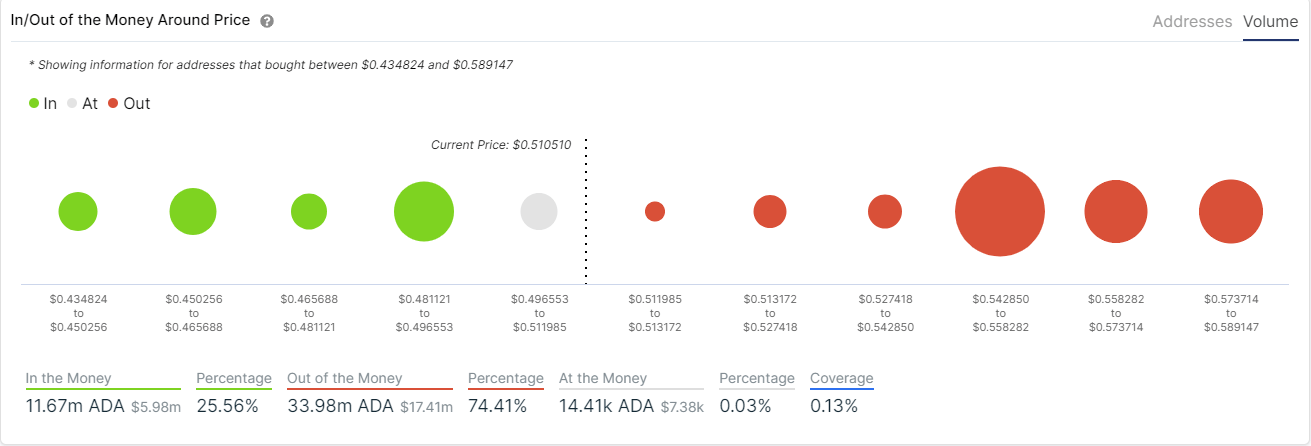
ADA IOMAP
It’s also important to note that the number of holders that held Cardano for longer than one year has fallen massively in the past year. On June 2020, the number of addresses holding ADA for longer than one year was around 213,000 and has dropped to only 177,000 now, which shows long-term holders have exited the network.
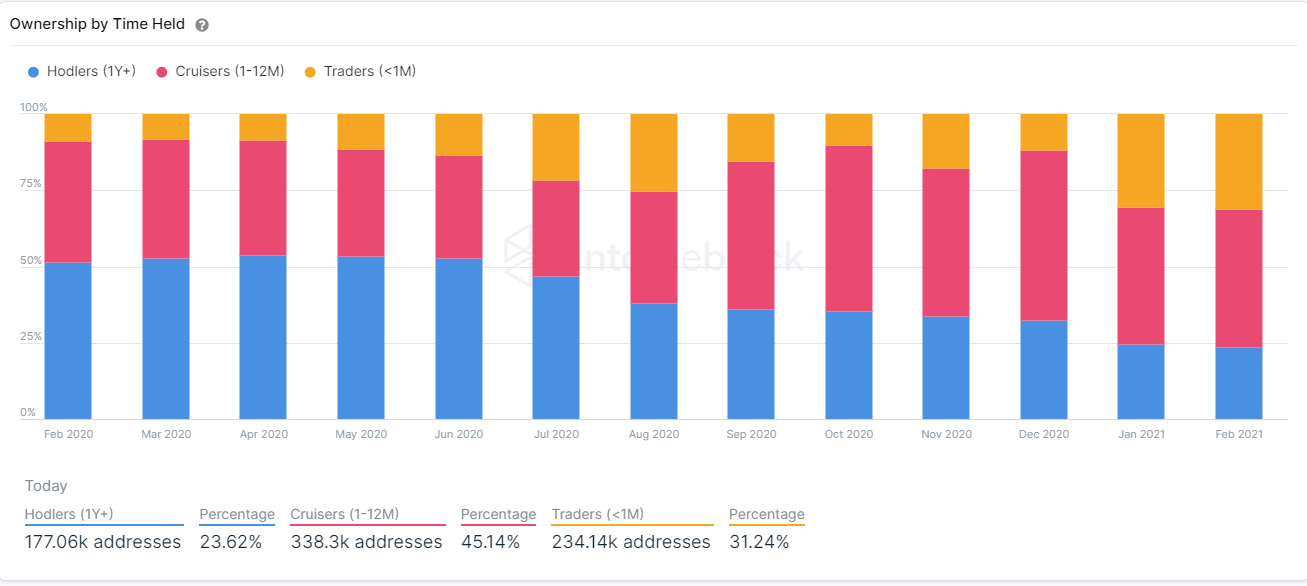
ADA Holders chart
Nonetheless, the entire cryptocurrency market is extremely bullish in the past several days and altcoins have been booming. According to the IOMAP chart, the most important resistance area is located between $0.54 and $0.55.
ADA/USD daily chart
A breakout above $0.55 would easily drive Cardano price towards the 127.2% Fibonacci level at $0.63. The next price target would be $0.77 which is the 161.8% Fib level.
