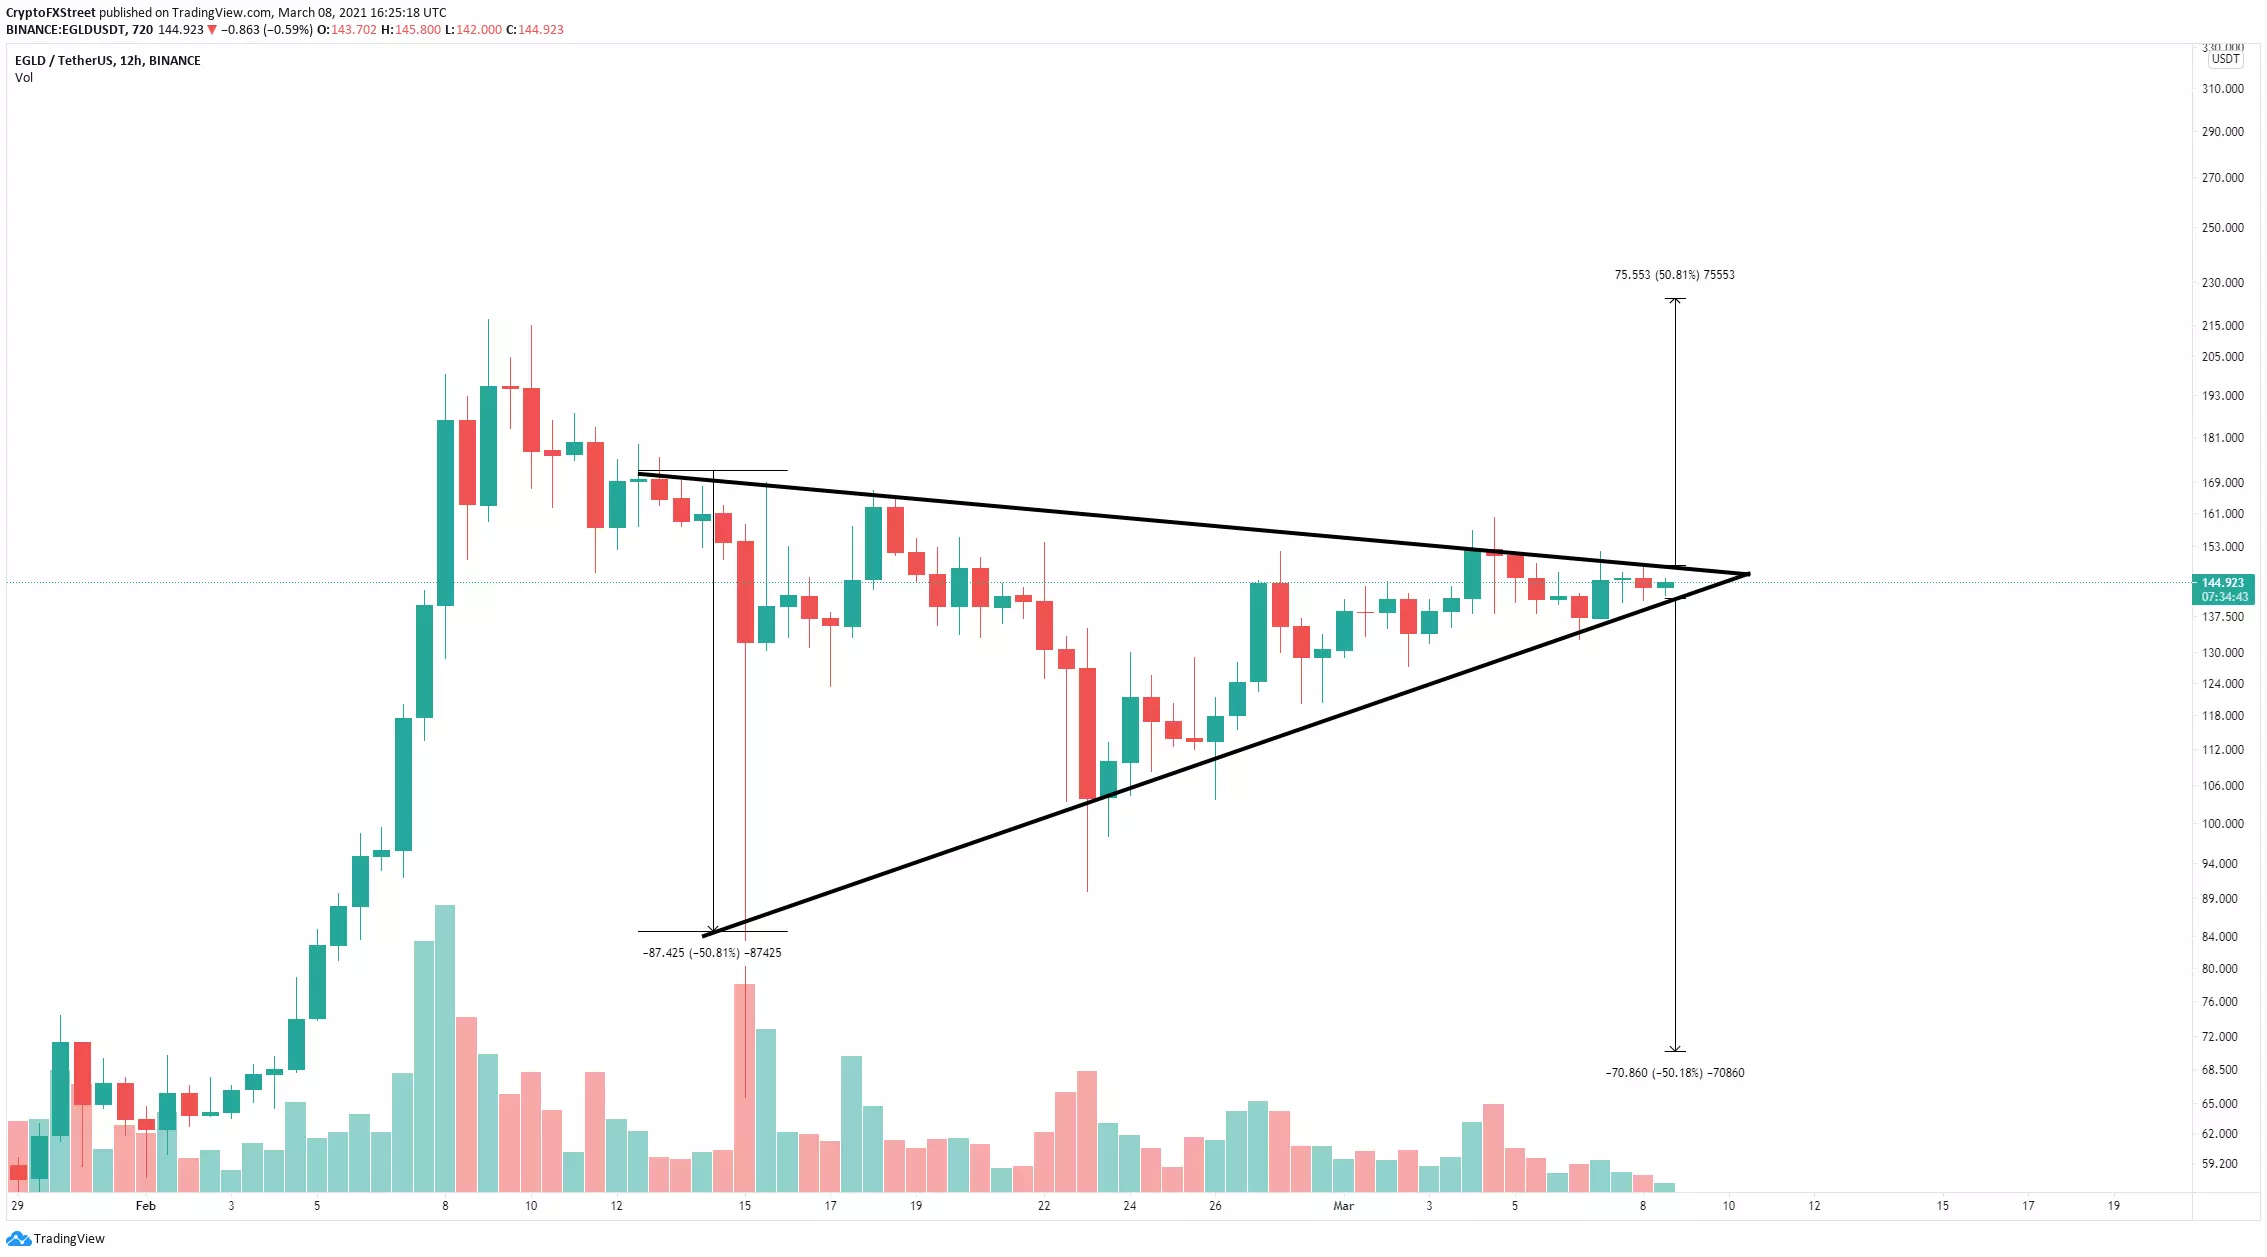
- Elrond price is contained inside a symmetrical triangle pattern on the 12-hour chart.
- The digital asset is on the verge of a colossal 50% move within the next 24 hours.
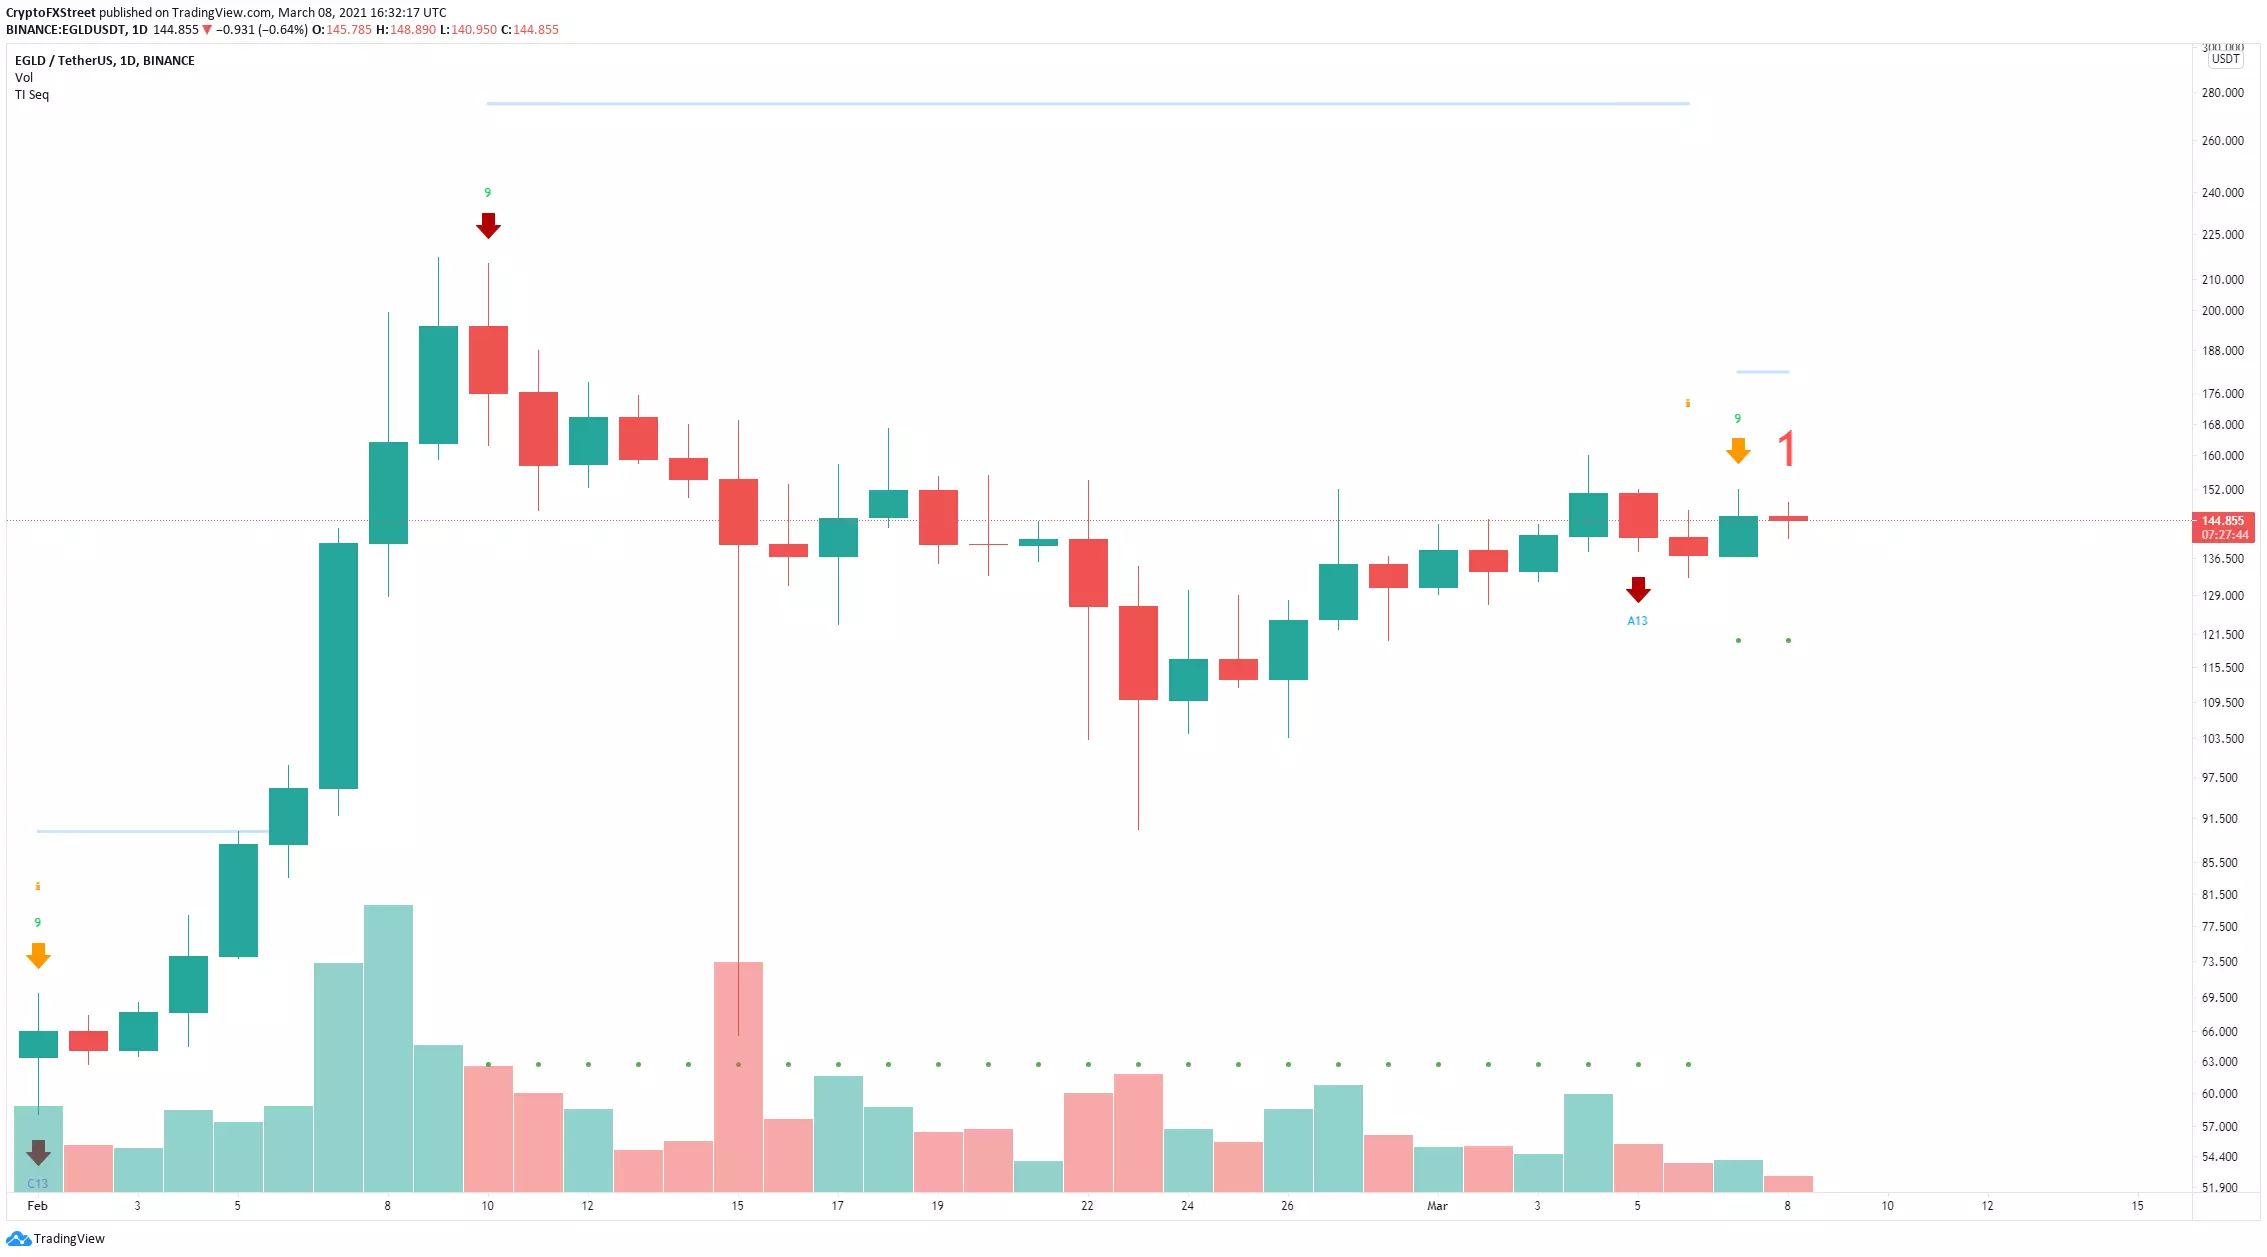
- A key indicator has presented a strong sell signal in favor of the bears.
Elrond has been trading inside a tightening range for the past three weeks and is poised for a massive breakout or breakdown within the next 24 hours.
Elrond price must climb above key level to see a 50% breakout
On the 12-hour chart, Elrond is right at the end of a symmetrical triangle pattern. There is a key resistance trendline formed at $150. A breakout above this point should drive Elrond to new all-time highs at $225.
EGLD/USD 12-hour chart
The pattern is on the brink of a breakout or breakdown. The entire cryptocurrency market is bullish, which should help EGLD buyers push the digital asset above the critical point.
EGLD/USD daily chart
However, on the daily chart, the TD Sequential indicator has presented a sell signal giving power to the bears. A breakdown below the lower boundary of the symmetrical triangle pattern will drive Elrond price down by 50%.


