- Bluzelle price is up by 40% in the past 24 hours.
- A key indicator has presented a strong sell signal for BLZ.
- The digital asset had a massive 700% rally since the beginning of 2021.
Bluzelle had an amazing 2021, outperforming many cryptocurrencies although its total market capitalization stays below $100 million for now. BLZ is listed on Binance and other prominent exchanges and has experienced a significant increase in trading volume in the past week.
Bluzelle price faces short-term selling pressure
On the daily chart, the TD Sequential indicator has presented a sell signal which in the past has proven to be an accurate indicator. Confirmation of this signal will easily drive Bluzelle price towards $0.29 at the 78.6% Fibonacci level.
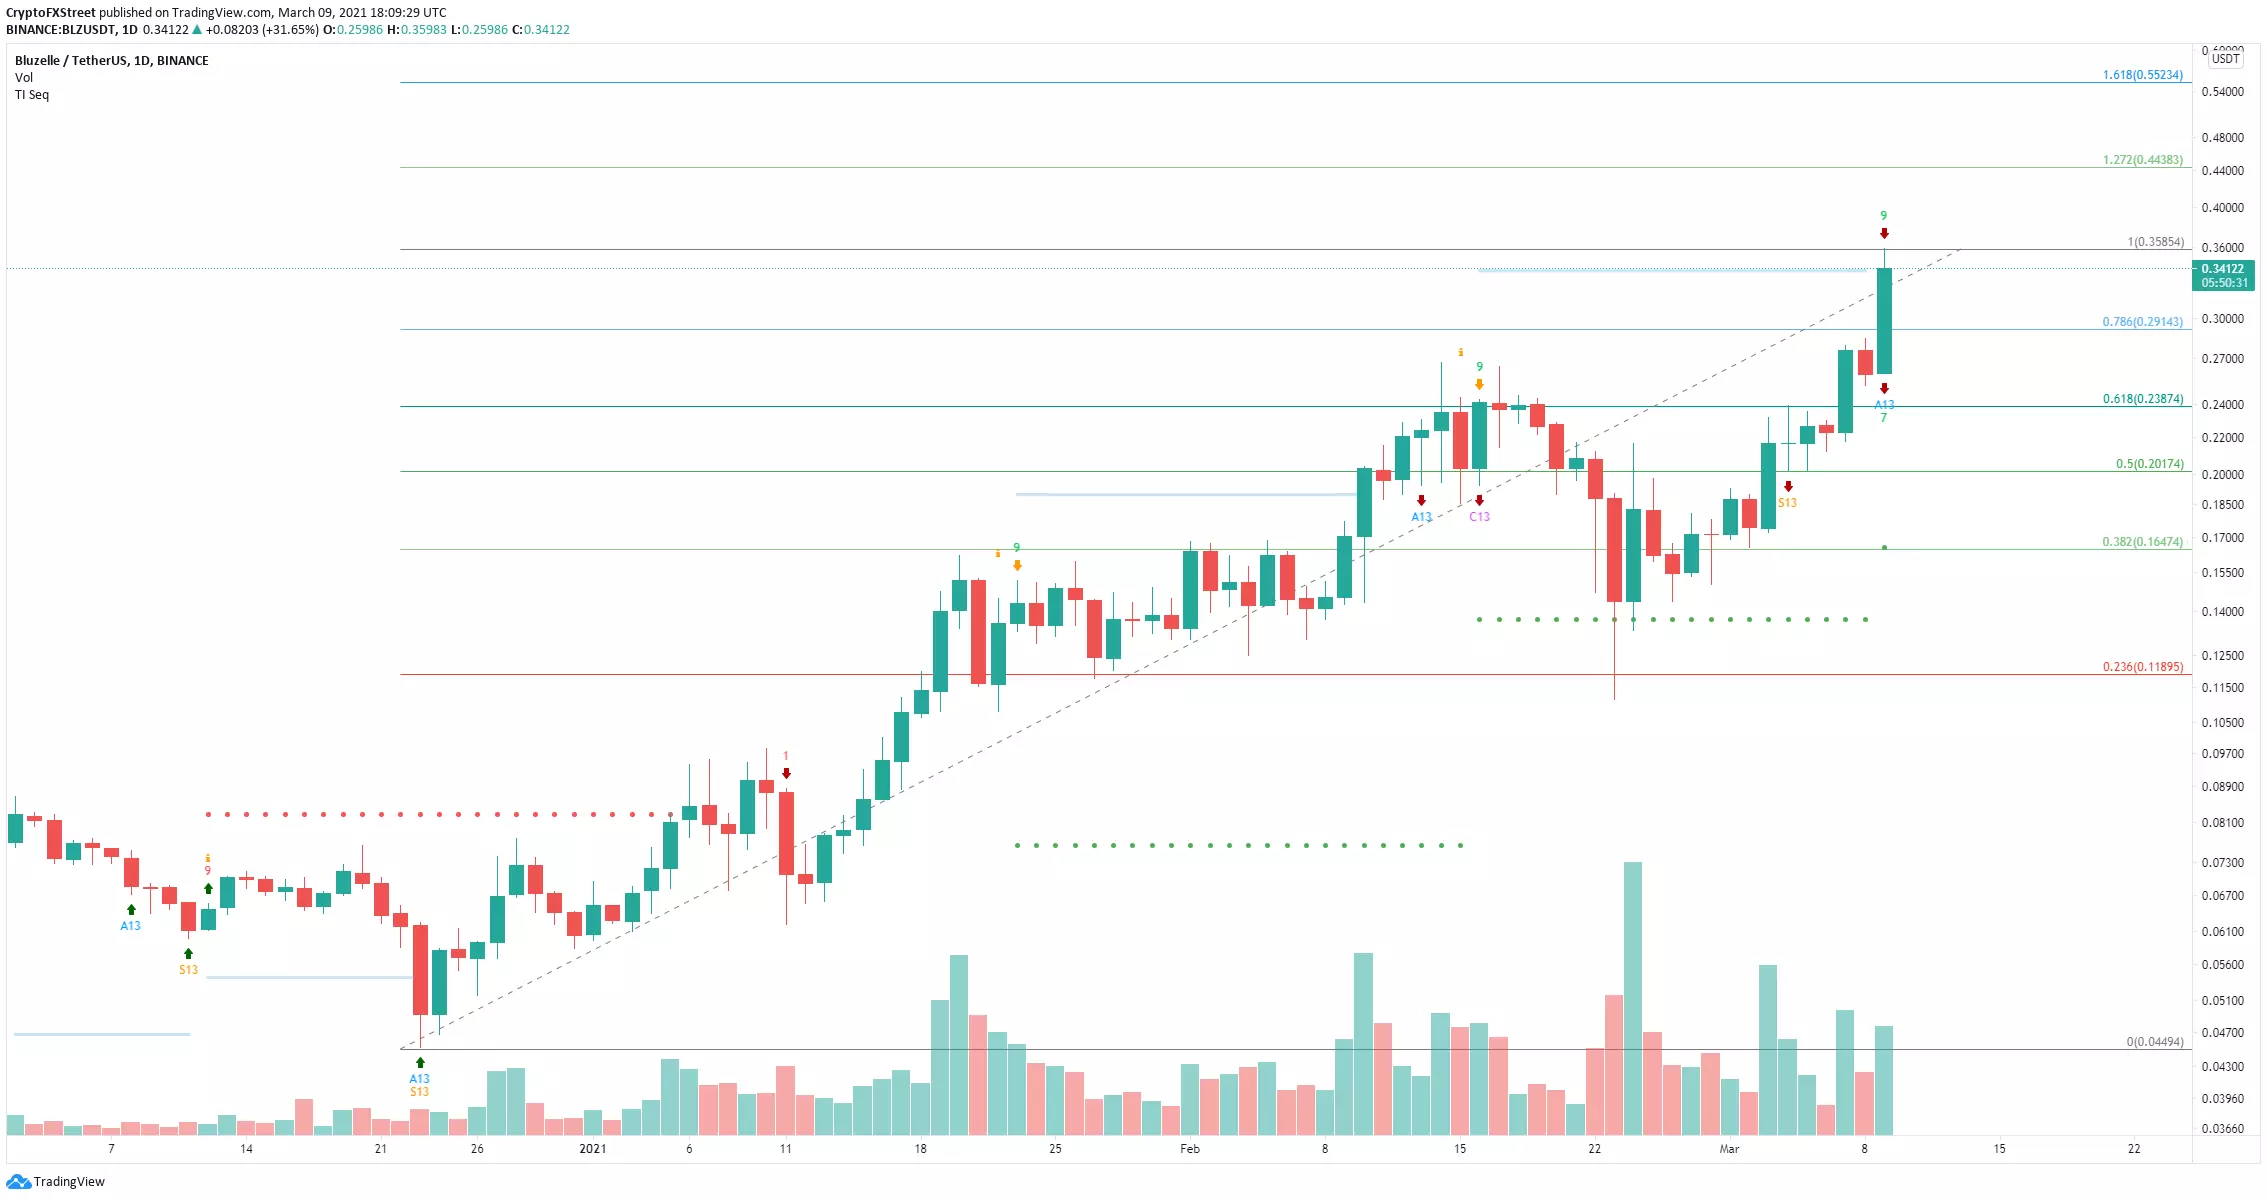
BLZ/USD daily chart
Below $0.29, BLZ could also dive to $0.238 at the 61.8% Fib level and as low as $0.20 at the 50% Fibonacci retracement level which coincides with two lows established on March 4 and 5.
-637509105523929713.png)
BLZ IOMAP chart
To invalidate the bearish outlook, bulls will need to push BLZ above the last high at $0.359 and see a daily candlestick close. This would make the sell signal useless and can quickly drive Bluzelle price towards $0.44 at the 127.2% Fib level.
The In/Out of the Money Around Price (IOMAP) chart shows fairly weak resistance above $0.34 which adds credence to the bullish outlook.
