- Enjin Coin price is contained inside a symmetrical triangle pattern on the 1-hour chart.
- The digital asset is on the verge of a significant 25% move if one of two critical levels breaks.
- It’s unclear which side has the upper hand, so traders must stay cautious.
Enjin Coin has been trading sideways for the past 24 hours and it’s contained inside a tightening range on the 1-hour chart. Two key levels stop the digital asset from a massive 25% move.
Enjin Coin price on the verge of a breakout or breakdown
On the 1-hour chart, ENJ has formed a symmetrical triangle pattern with a resistance trendline set at $2.6 and support at $2.41. A breakout above the key barrier at $2.6 would drive Enjin Coin price towards $3.3 in the long-term.
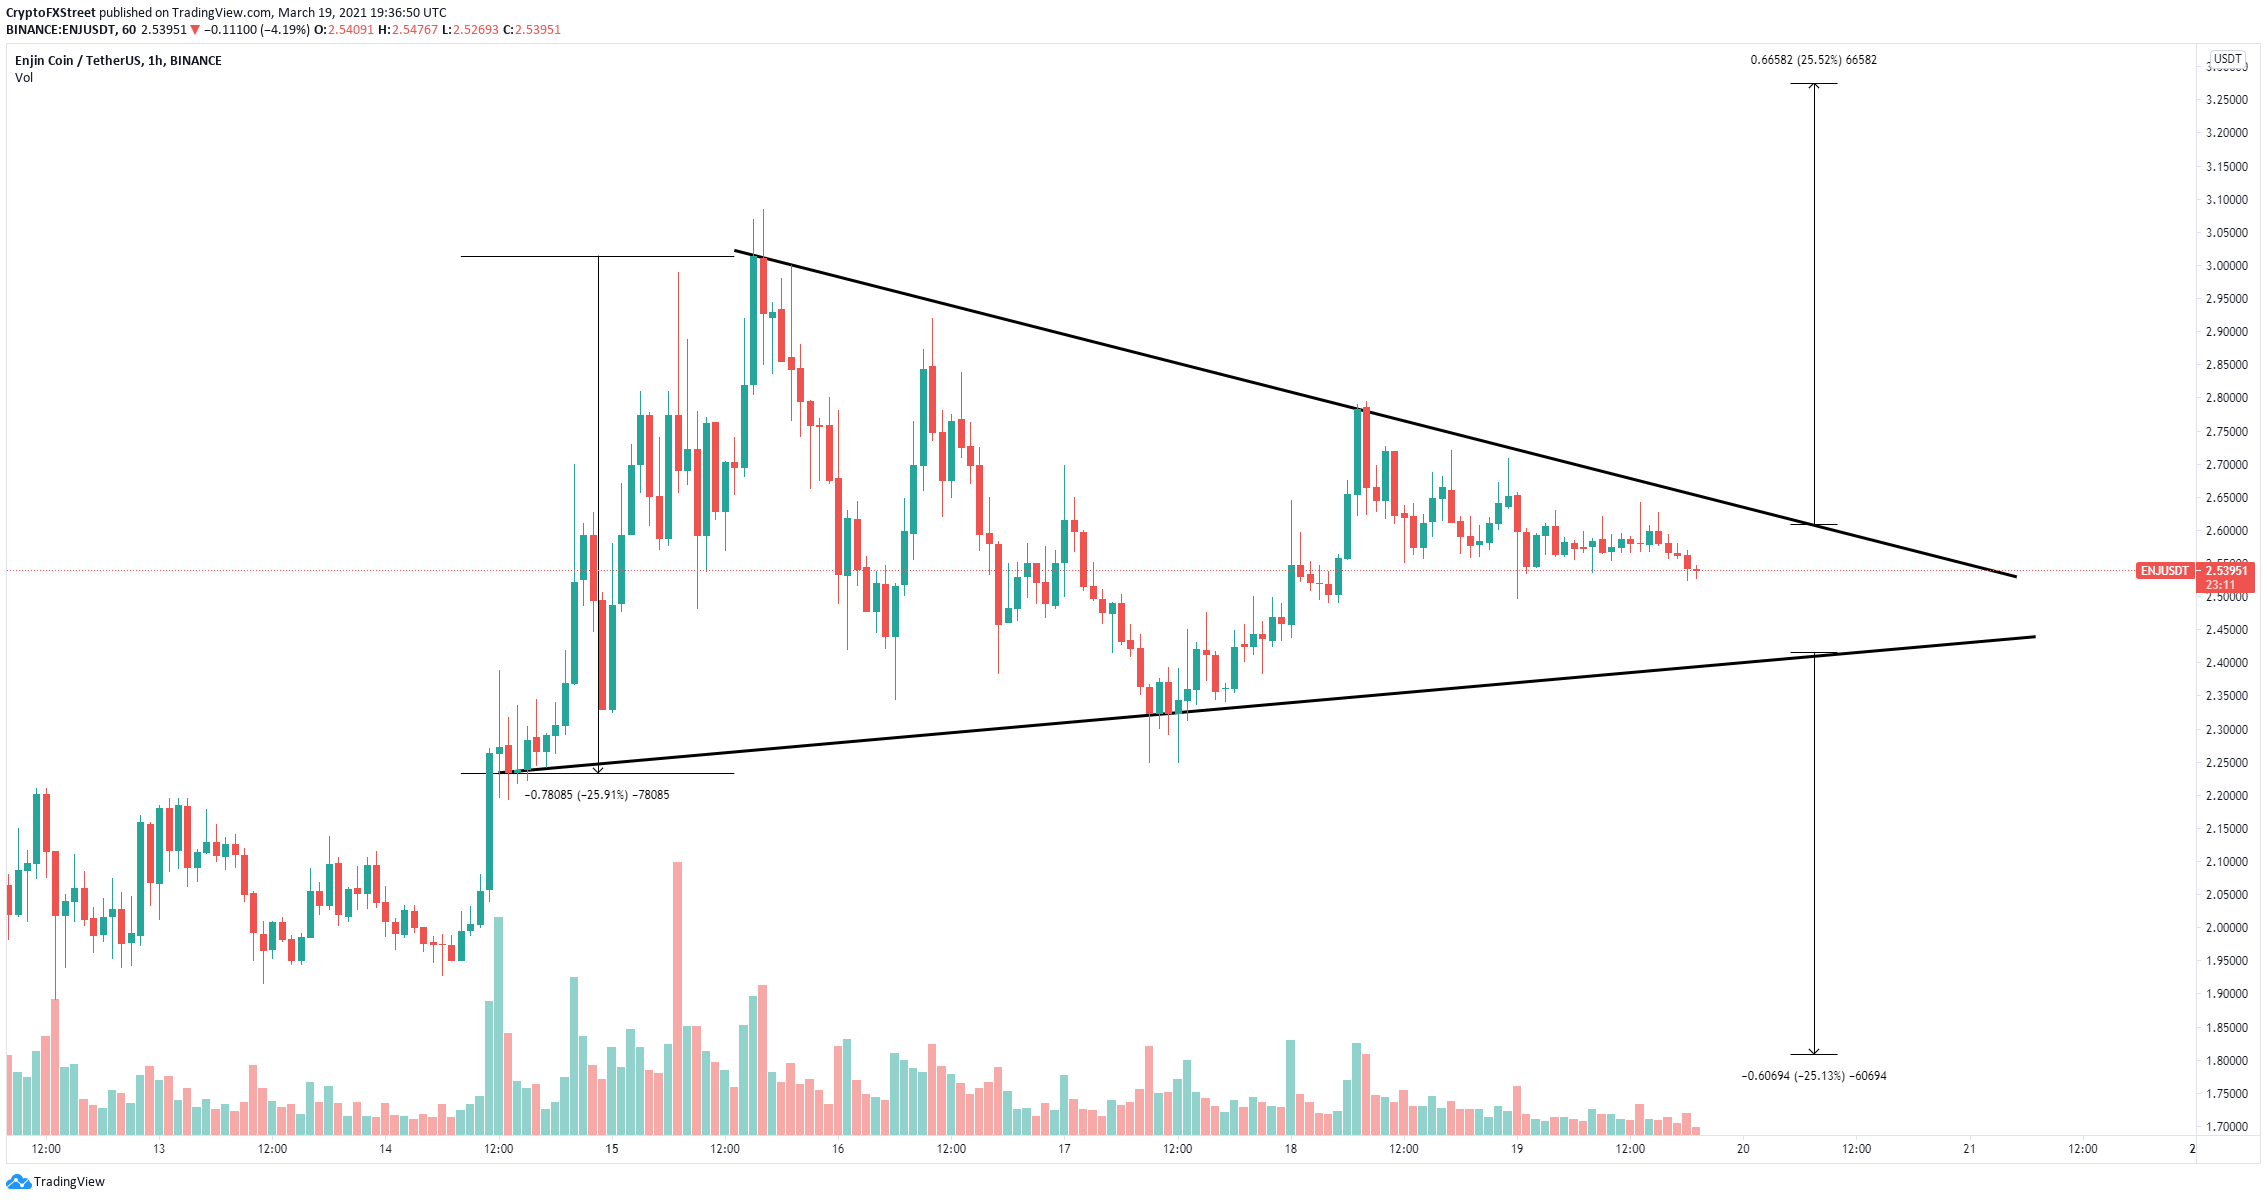
ENJ/USD 1-hour chart
On the other hand, a breakdown below $2.41 would send the digital asset towards a low of $1.8. The current price of ENJ is $2.5, which means Enjin is right in the middle of the pattern.
