- BTC/USD bounces off one-week low after extending downside break of one-month-old support line.
- MACD flashes most bearish signals in two weeks.
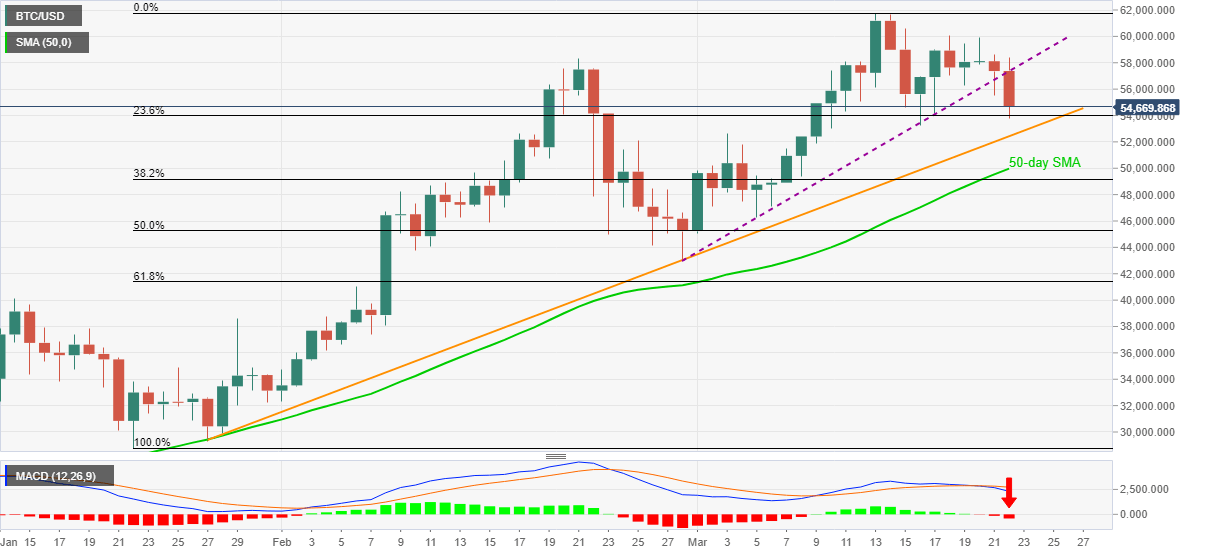
- 50-day SMA adds to the support, February top can probe buyers beyond previous support.
Bitcoin bears catch a breather around $54,850 following a heavy downfall to $53,756 on late Monday. In doing so, the crypto major portrays a corrective pullback after declining to the lowest in one week on the key support line breakdown.
Even if the BTC/USD manages to bounce towards the $55,000 resistance, the sellers remain hopeful unless the quote reverses the latest trend line break. Also suggesting further downside could be the most bearish MACD since March 06.
Hence, bitcoin bears can aim for an ascending support line from January 27, currently around $52,300, despite the latest recovery moves. Though, any further weakness will be challenged by the $50,000 threshold and 50-day SMA level of $49,970.
Meanwhile, recovery moves beyond the $55,000 immediate resistance need to cross the previous support line, at $57,300, to challenge the February high of $57,567.
Also likely to test the BTC/USD bulls is $58,980 and the $60,000 round-figure, a break of which will post a serious challenge to the record top of $61,774.
BTC/USD daily chart
Trend: Further weakness expected
