- Polkadot price emerging from a 36-day consolidation.
- February 18 high becoming a stubborn resistance level.
- Speed, cost, and stability headline DOT network value.
Polkadot is struggling to build on the April 3 breakout over the last four days, while volume is not showing emotion or commitment. Nevertheless, upside targets include the consolidation measured move and two Fibonacci extension levels.
Polkadot price may need a new catalyst
A 33% correction following an 800% rally from the end of December 2020 is a constructive development for DOT traders and mild relative to the losses suffered in other cryptocurrencies.
The current DOT breakout follows a 33-day consolidation, but it is proving to be a battle to clear the February 18 high at $42.71. If the resistance evaporates, traders can look forward to a burst to the 161.8% Fibonacci extension of the February correction at $53.15. The measured move target of 33% puts the next resistance level at $54.51.
Ambitious traders should look to the 261.8% extension at $70.04 as notable resistance.
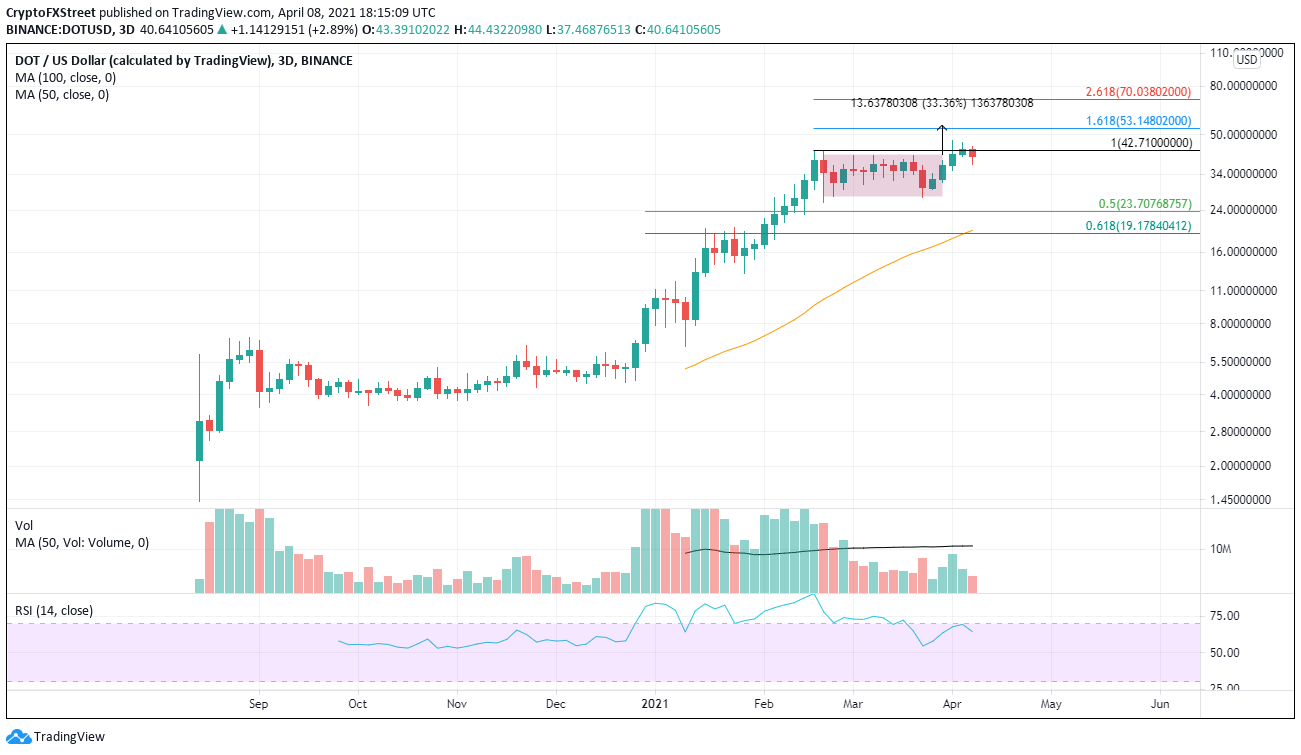
DOT/USD 3-day chart
A retreat into the consolidation is not unusual, but it should hold the 50-day simple moving average at $36.07. If DOT melts through the moving average, the next layer of support is the low of the consolidation at $27.55, followed by the 100-day SMA at $26.46.
A burst of selling pressure would knock DOT to the 50% retracement level of the 2021 advance, followed by the 61.8 retracement level at $19.18.
