- Chiliz price is contained inside a head-and-shoulders pattern on the 4-hour chart.
- CHZ faces a significant resistance point which stops it from advancing further.
- The digital asset needs to hold a crucial support level to avoid a massive fall.
Chiliz price is down by 44% since its all-time high of $0.84 on April 16. The digital asset has experienced massive volatility in the past several weeks after several positive announcements.
Chiliz price must hold crucial support level
On the 4-hour chart, it seems that CHZ has formed a head-and-shoulders pattern with its neckline located at $0.47. A 4-hour candlestick close below this key point would confirm a breakdown of the pattern.
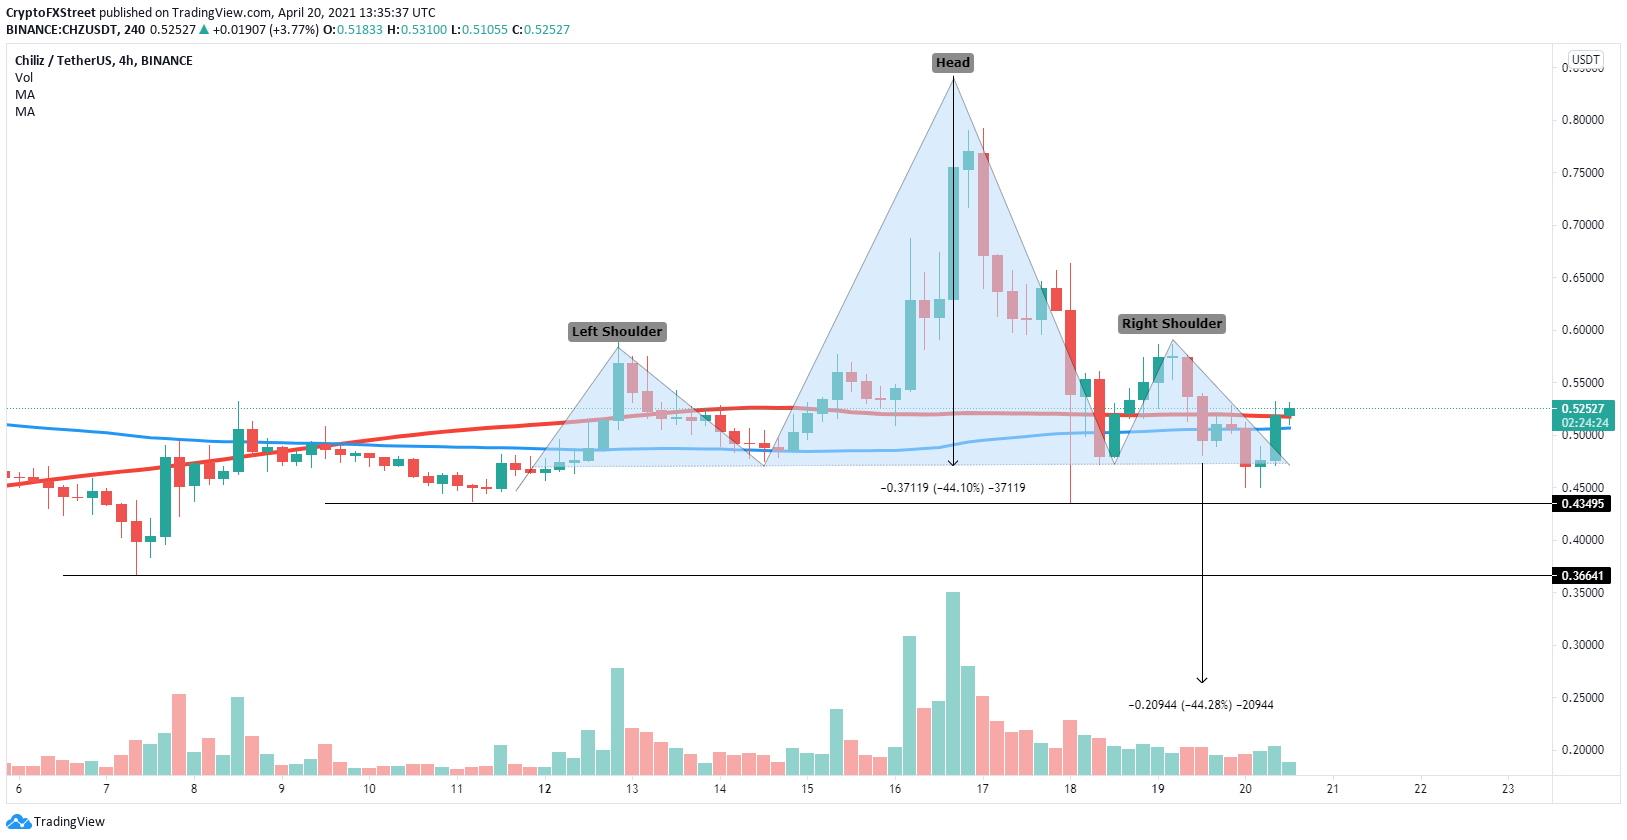
CHZ/USD 4-hour chart
The height of the pattern from the top to the neckline is 44% which would also be the long-term price target of the breakdown.
There are other price targets on the way, first at $0.435 and the second at $0.366 which are previous lows of CHZ.
The biggest asset of the bulls is the 26 EMA on the daily chart which has held the price for several months.
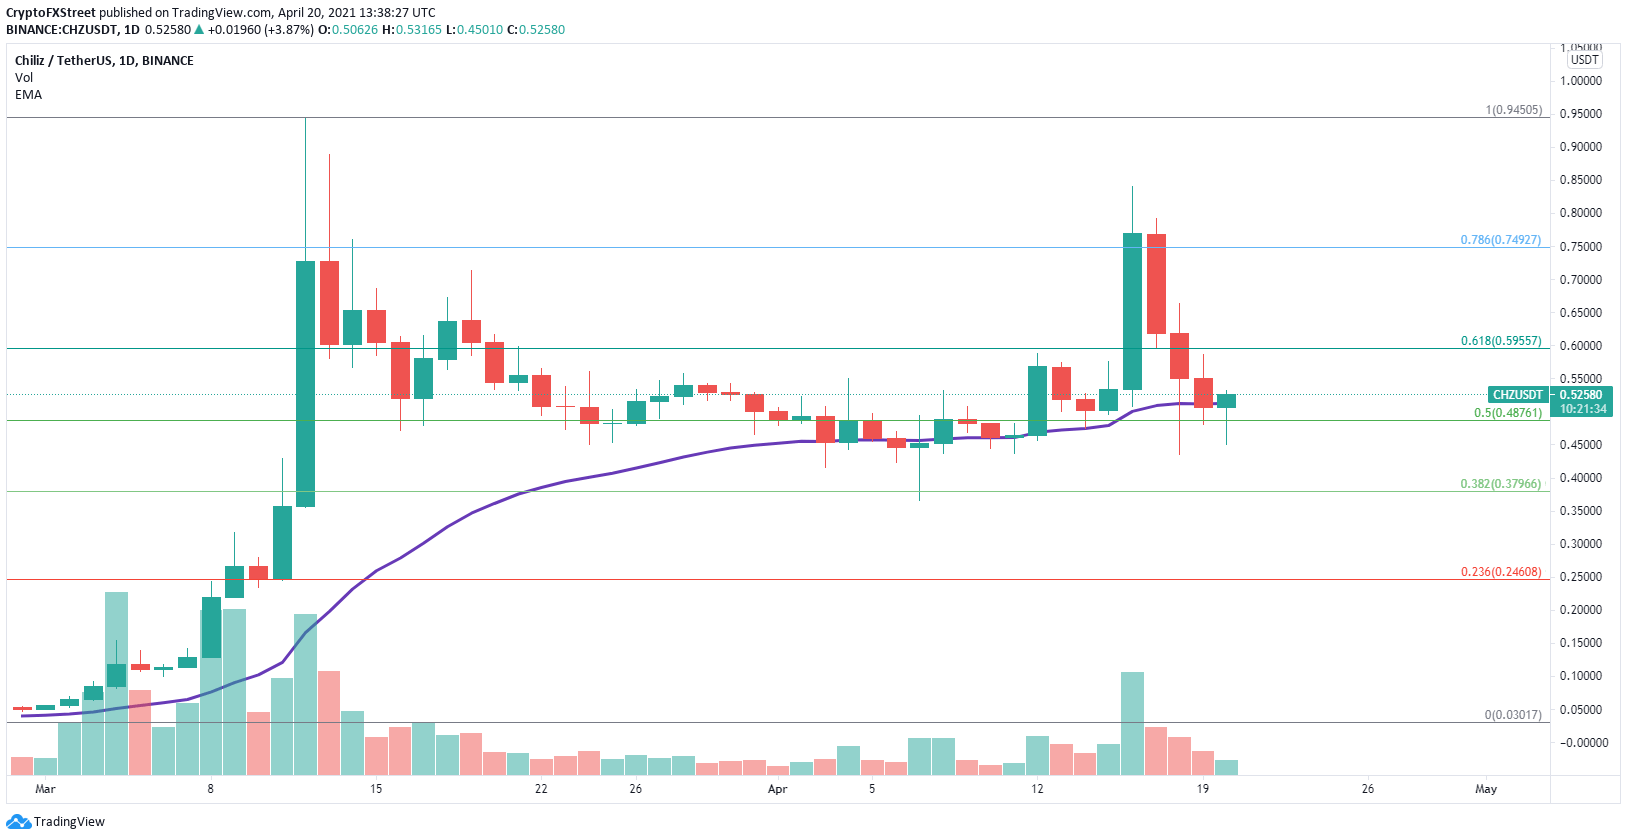
CHZ/USD daily chart
If Chiliz can stay above this key support level, it can quickly shoot up toward $0.60 at the 61.8% Fibonacci retracement level as there isn’t a lot of resistance ahead.
