- Bitcoin price has dropped 12.7% since yesterday and shows no signs of stopping.
- Ethereum price follows the pioneer crypto’s lead and might retest $2,000 again.
- Unlike BTC or ETH, XRP price shows signs of recovery as long as it stays above a critical demand zone.
Bitcoin price has crashed twice within ten days, taking the entire cryptocurrency market into a tailspin. While some altcoins have recovered, BTC hints at an extension of this slump.
Bitcoin price eyes $45,000
Bitcoin price is hovering below the 100-day Simple Moving Average (SMA) at $49,365. The last time BTC closed below this level was on September 23, 2020. Therefore, a breakdown of this crucial barrier will trigger sellers to offload their holdings.
If such a scenario were to develop, Bitcoin price would head toward a significant support area that extends from $47,500 to $43,002.
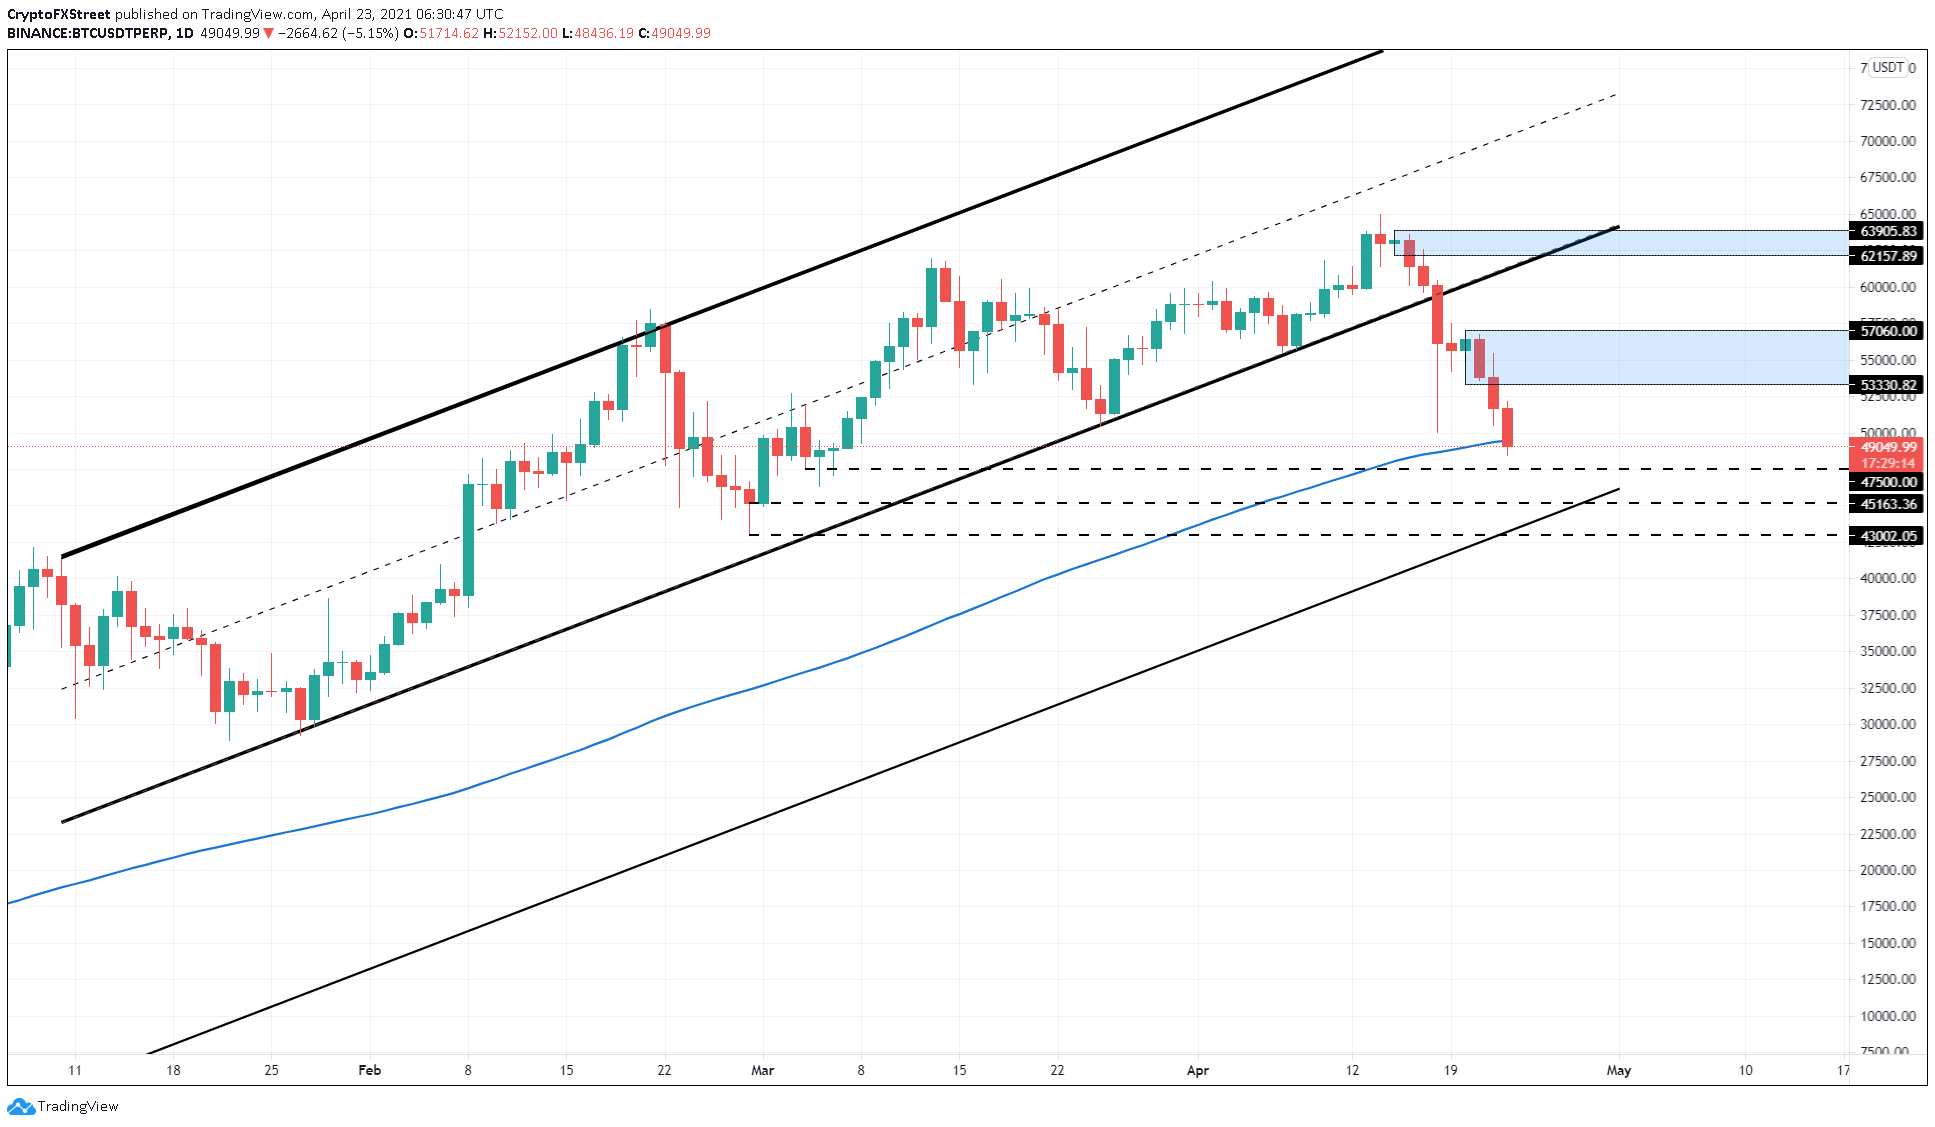
BTC/USDT 1-day chart
However, a bounce from the 100 SMA could push the flagship crypto toward the demand zone, stretching from $53,330 to $57,060.
Ethereum price looks to retest $2,000
Ethereum price is promptly following BTC’s lead and has undone almost all of yesterday’s gains. Now, ETH is trading at $2,200 and could slide another 5.5% to $2,000.
The SuperTrend indicator’s recently spawned sell signal supports this downtrend.
Under dire circumstances, the pioneer altcoin could retest the 200 four-hour SMA at $2,038.
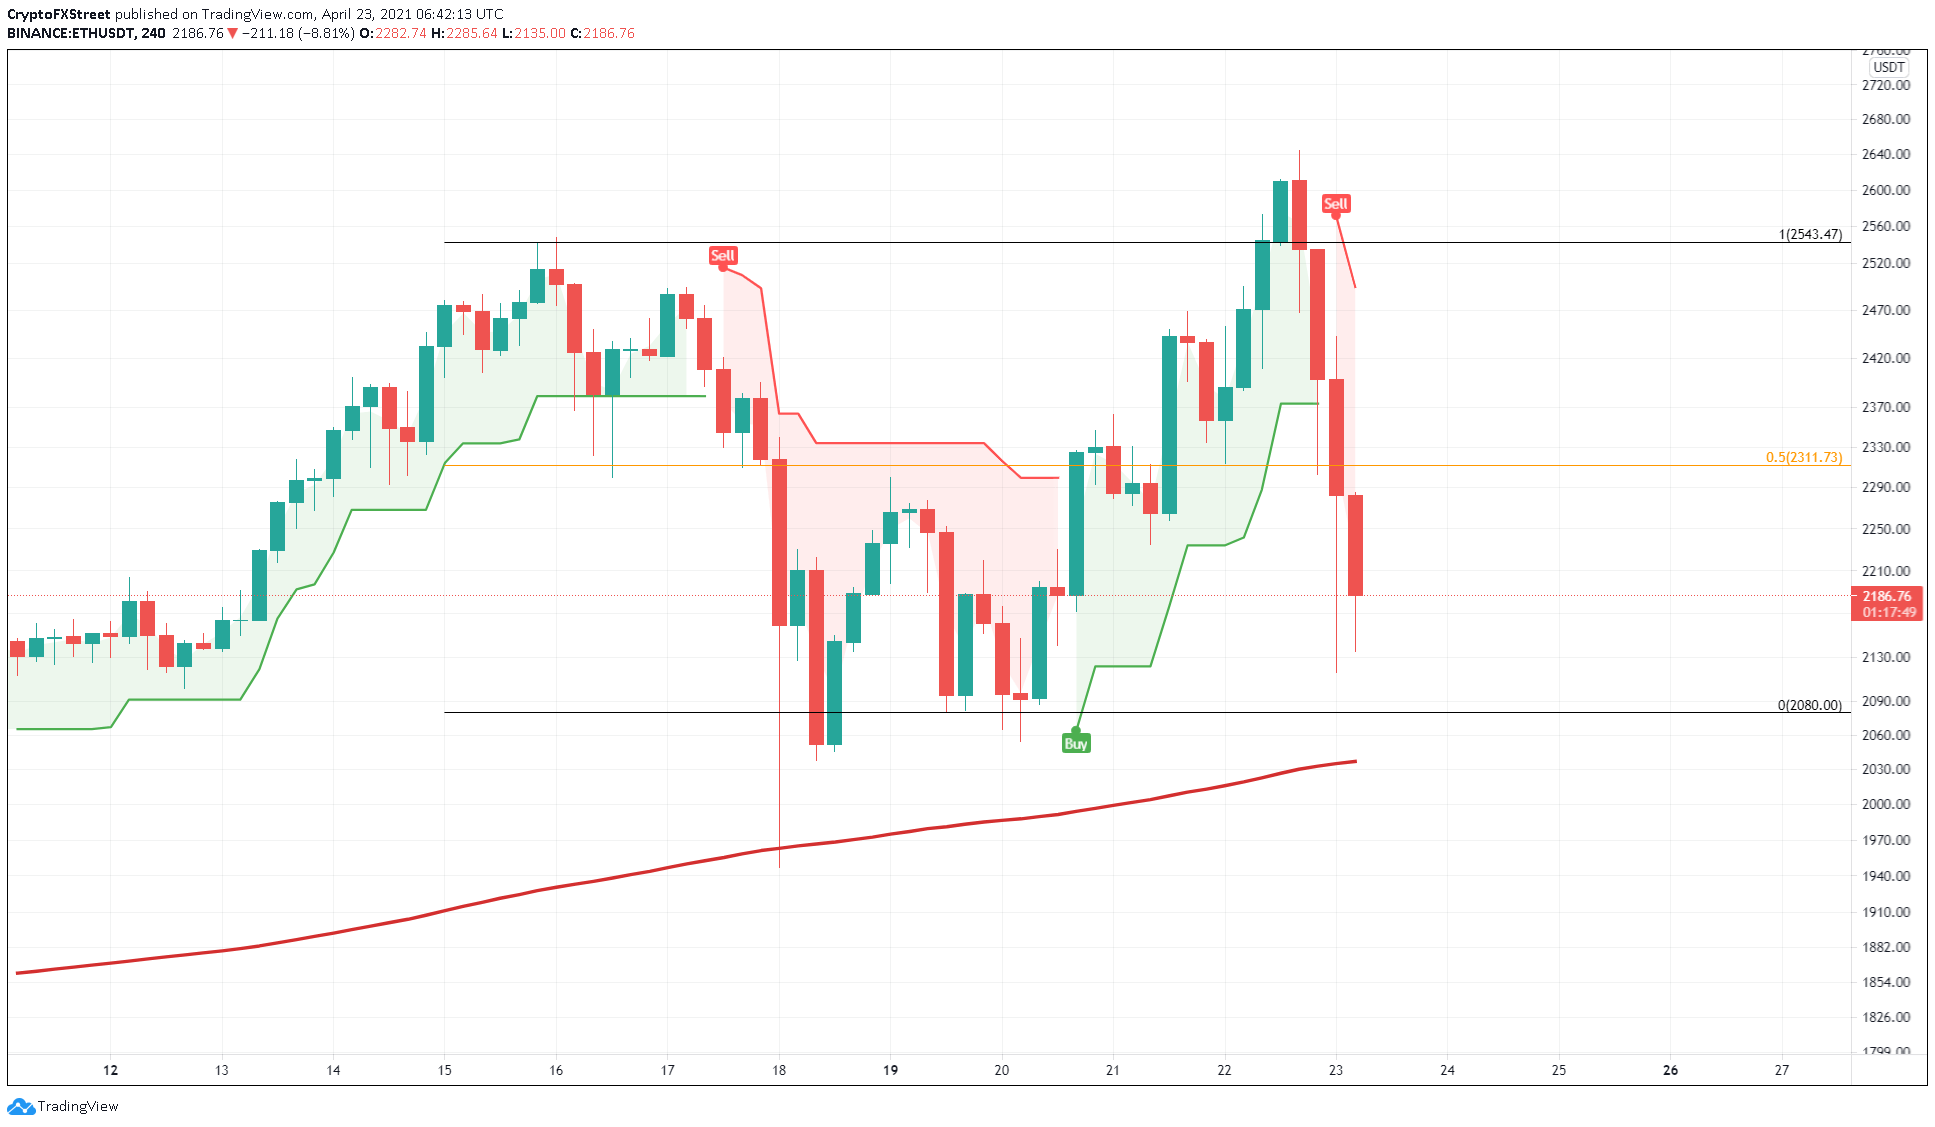
ETH/USDT 4-hour chart
Regardless of the bearish pressure, buyers might rescue Ethereum price around the psychological level of $2,000. If the bid orders keep rising here, ETH could head to retest the 50% Fibonacci retracement level at $2,311.
XRP price may have started its recovery
XRP price has sliced through the 50 SMA and is testing the 200 SMA on the four-hour chart. Interestingly, the demand barrier’s upper boundary at $0.977 coincides with the 200 SMA. Moreover, XRP investors show extreme resilience in this area as they have scooped up a previous spike below this level.
Hence, a bounce seems likely.
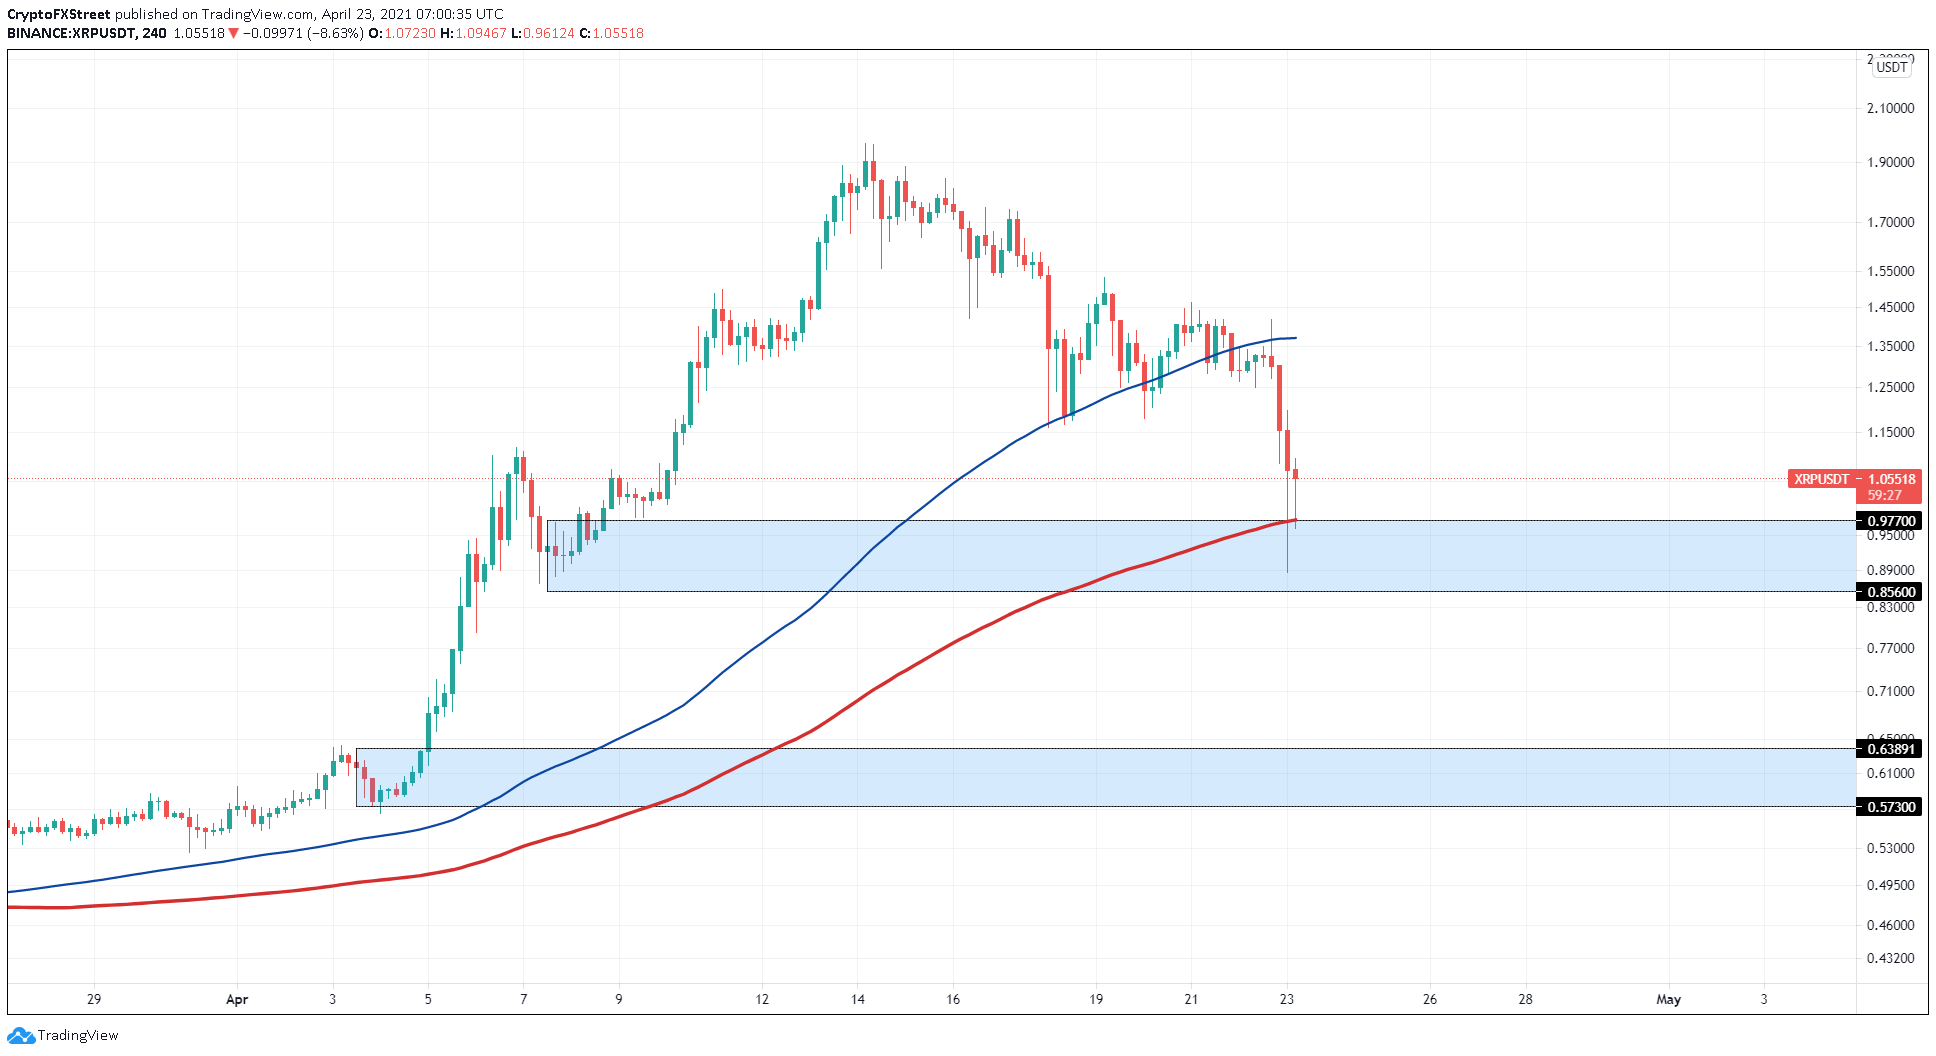
XRP/USDT 4-hour chart
Considering the bearish nature of the entire cryptocurrency market, it wouldn’t be surprising if the said area of demand is breached. In such a case, market participants can expect the remittance token to head to the subsequent support zone that ranges from $0.573 to $0.638.
