- Ethereum price remains bounded inside an ascending broadening wedge pattern on the 12-hour chart.
- The digital asset defends a key support level on the 12-hour chart in the form of the 50 SMA.
- The entire cryptocurrency market has seen a significant crash in the past week.
Ethereum just established a new all-time high at $2,644 on April 22, but the entire market had a flash crash in the last 24 hours and ETH also dropped to a low of $2,107.
Ethereum price defends key level and aims for a rebound
On the 12-hour chart, Ethereum price has managed to stay above the 50 SMA support level at $2,157 and aims for a rebound into new all-time highs. The upper boundary of the ascending broadening wedge pattern is located at $3,000.
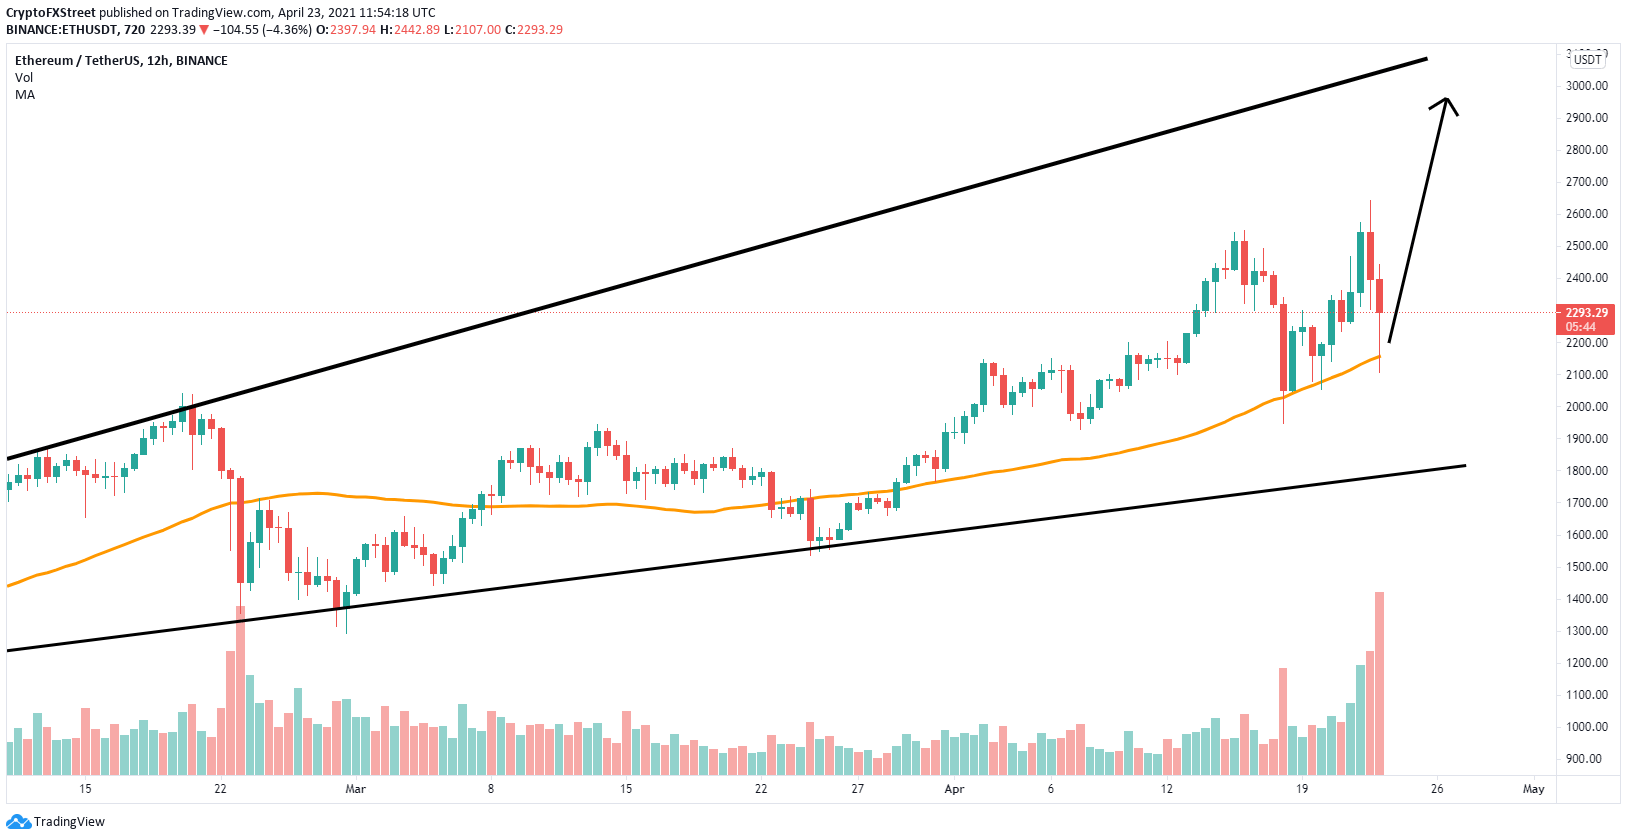
ETH/USD 12-hour chart
The In/Out of the Money Around Price (IOMAP) chart shows only one crucial resistance area between $2,301 and $2,336 where 35,000 addresses purchased over 8.3 million ETH. A breakout above this range should drive Ethereum price to at least its previous all-time high.
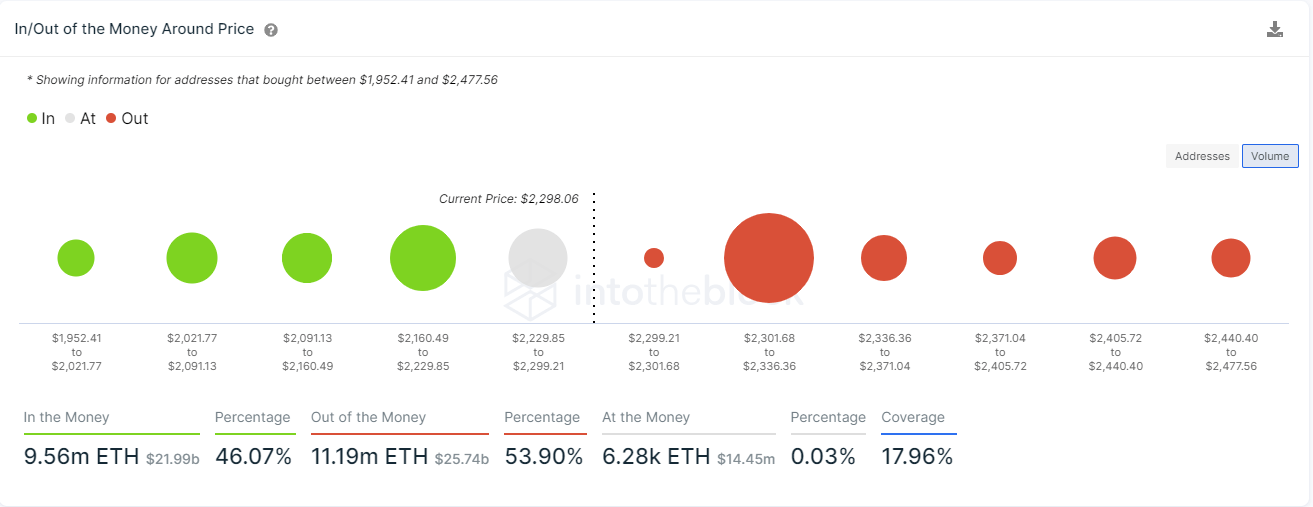
ETH IOMAP chart
However, at the same time, the IOMAP model also indicates weaker support below. If the area between $2,160 and $2,229 fails to hold, Ethereum price would easily drop toward the psychological level at $2,000.
