- Algorand price is contained inside an ascending broadening wedge pattern on the 12-hour chart.
- The digital asset must climb above a key resistance level for a massive breakout.
- Algorand momentum shifted in favor of the bears in the last week.
Algorand price had a massive rally in February and another spike on April 17 to $1.8. However, the digital asset got rejected from a key resistance trend line and is trying to hold above a significant support level.
Algorand price aims for a massive breakout
On the 12-hour chart, Algorand price has formed an ascending broadening wedge pattern that can be drawn connecting the higher lows and higher highs with two trend lines that separate from each other.
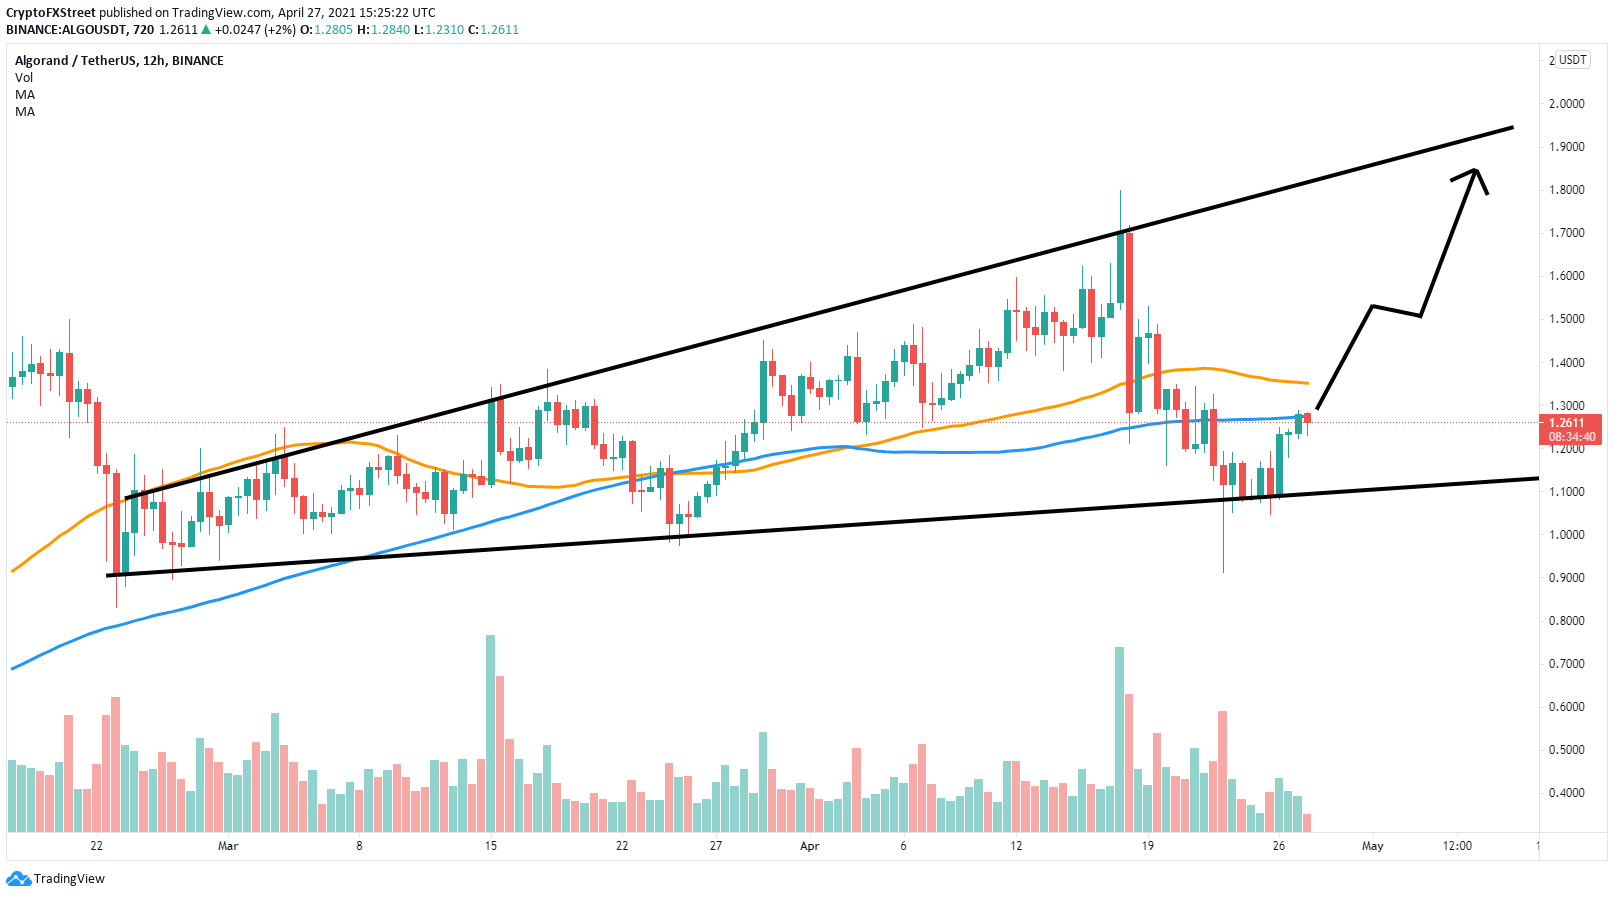
ALGO/USD 12-hour chart
There is a strong resistance area between $1.27 to $1.33 where the 50 SMA and the 100 SMA are currently located. A breakout above this point should quickly drive Algorand price toward $1.5 initially and as high as $1.9 in the longer term.
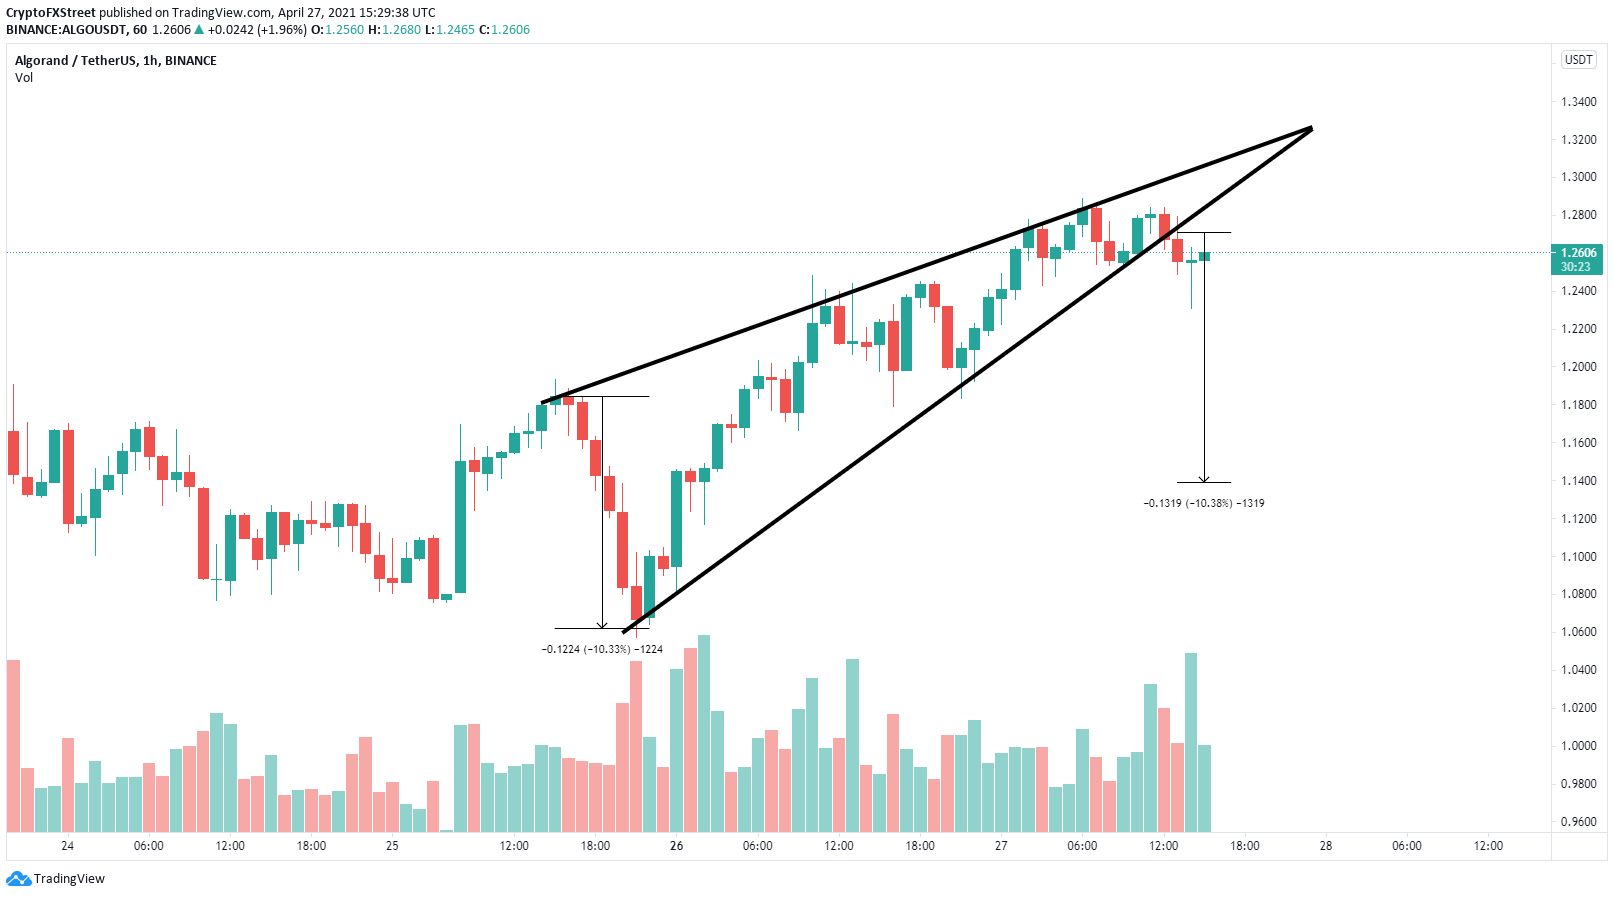
ALGO/USD 1-hour chart
However, on the hourly chart, Algorand had a breakdown from an ascending wedge pattern which has a 10% price target down to $1.14. The only support level in-between is located at $1.18.
