To call the past week in USD/JPY “volatile” would certainly be an understatement. The pair reached new highs only to crash in erratic moves. Speeches by the governor of the BOJ, retail sales and inflation data are the main events this week. Here’s an outlook for the Japanese events and an updated technical analysis for USD/JPY.
The 7.32% crash in the Japanese stock markets send USD/JPY from the new multi-year highs to much lower ground. Also the rising bond yields, despite massive QE, are the first test for “Abenomics”. Some fear that Japan might lose control. Also the possibility of tapering QE in the US weighed on the pair. Following the extraordinary QE program on April 4th, the Bank of Japan made no policy changes for the second time in a row. The central bank is looking to expand the size of the monetary base raising its economic assessment in light of recent improvements.
Updates:
- Japanese inflation numbers continue to disappoint, as we continue to see deflationary trends despite the aggressive monetary easing taken by the BOJ. CSPI, which measures corporate inflation, posted a reading of -0.4%, worse than the previous release of -0.2%. Retail Sales will be released on Tuesday.
- USD/JPY jumped over one 100 points on Tuesday, helped by a recovering Japanese stock market. The pair pushed above the 1.02 line, and was trading at 102.20.
- Dollar/yen extended its gains after a better than expected consumer confidence number in the US. The 5 year high in confidence pushes US bonds higher, and this also supports the pair. More: Market Volatility Prevalent in Japan.
- A sudden, violent dollar fall sends USD/JPY down to dip under 101 from the previous highs.
- USD/JPY crashes with the Nikkei, once again: Another bad Thursday for Japanese stocks sends USD/JPY as low as 100.46. The round number is close.
- Retail Sales posted a decline of 0.1%. Although this beat the estimate of -0.4%, the decline points to weak consumer spending in Japan, despite the extreme monetary easing undertaken by the central bank. BOJ Governor Haruhiko Kuroda spoke at an international conference in Tokyo. The markets will get a look at some key data on Thursday, including inflation numbers and Preliminary Industrial Production. USD/JPY has taken a sharp drop as the Nikkei continues to show volatility. The pair was trading at 100.69.
- Roller coaster: Talk about Japanese funds moving towards stocks send USD/JPY higher. But then, US GDP and jobless claims disappointed, and helped the yen recover. Another disappointment from pending home sales pushed Dollar/yen below 101 once again. Tapering will take time.
- Closer to 100: End of month flows mean some dollar correction. USD/JPY is heavy. It fell to 100.21 before recovering. A break of 100 could snowball quite fast. However, we could see a leap upwards after the EOM fixes are over.
- Analysis: USDJPY and S&P Futures – Both Looking Bearish (Elliott Wave Analysis)
- Despite some post end of month dollar strength, the yen found new strength and USD/JPY closed down at 100.44. Could we see a break of 100?
USD/JPY daily chart with support and resistance lines on it. Click to enlarge: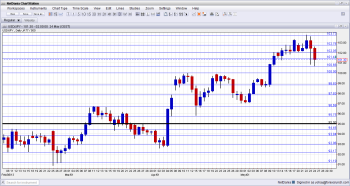
- Haruhiko Kuroda speaks: Sunday, 4:50, Wednesday 00:00. BOJ Governor Haruhiko Kuroda is scheduled to speak in Tokyo. He may speak about the positive developments in Japan’s economy and may share some important information concerning future monetary policy and interest rates. His words may cause volatility in the market. It will be interesting to see if tried to strengthen the yen, like the economy minister did, or rather weaken it with pledges to buy as many bonds as needed.
- Monetary Policy Meeting Minutes: Monday, 0:50. Bank of Japan policymakers decided on their April 3 to 4 policy meeting that the central bank needs to introduce a new phase of monetary easing to convince manufacturers of their earnest intentions of changing terms of scale, in order to reach the goal of the 2% inflation. However, some members stressed the possible effects of the drastic easing policy, such as restrained investment of institutional investors, as well as a rise in speculation that the BOJ was engaged in financing the government’s debt.
- CSPI: Tuesday, 0:50. An index measuring corporate service prices in Japan dropped 0.2% in March from the previous year, following a flat growth in February. Economists expected a 0.4% decline in March. On a monthly basis, the corporate service price index climbed 0.7%, which was better than the 0.3% rise registered in February. Another fall of 0.2% is forecasted now.
- Retail Sales: Wednesday, 0:50. Japan’s retail sales fell 0.3% in March, declining for the third straight month. Consumer spending is showing signs of recovery but retail sales remain weak compared with a year before. A substantial recovery from deflation needs higher wages and more job creation, which will boost demand for automobiles and consumer electronics. The downside effect from the termination of car subsidies is likely to continue until August or September. A further decline of 0.4% is likely.
- Manufacturing PMI: Friday, 0:15. Japanese manufacturing activity expanded in April rising above the 50.4 reading registered in March, to a seasonally adjusted 51.1. This is an encouraging sign that overseas demand is stabilizing. The output component of the PMI index climbed to 52.1 in April from 51.3 in the previous month. The Japanese government’s new monetary policy helped to reduce the yen to a four-year low, supporting economic activity.
- Household Spending: Friday, 0:30. Japan’s household spending edged up in March at the fastest pace in nine years, rising 5.2% form a 0.8% growth in the previous month. The reading topped forecast of a 1.8% gain. The positive increase occurred due to Prime Minister Shinzo Abe’s bold monetary policy, aiming to end two decades of stagnation. Another climb of 3.1% is expected this time.
- Tokyo Core CPI: Friday, 0:30. Japan’s core consumer price index, declined 0.5% in March from a year earlier, a bit worse than the 0.4% fall expected. Meanwhile, The April core CPI for metropolitan Tokyo, registered a 0.3% yearly drop, but was better than the 0.5% drop registered in March. Tokyo Core CPI is predicted to decline 0.2%, while the National Core CPI is expected to drop 0.4%.
- Industrial Production: Friday, 0:50. Japan’s industrial output increased 0.2% rising for the fourth straight month in March in light of an improvement in foreign demand and the effects of the weaker yen on exports. The reading followed a 0.6% climb in February. Overseas demand for Japanese automobiles and general machinery is also improving. The recent encouraging figures in the industrial sector prove that industrial output “has bottomed out and shows some signs of picking up. Another 0.8% gain is forecasted.
- Housing Starts: Friday, 6:00. Housing starts in Japan humped 7.3% in March from a year earlier, rising for the seventh straight month, following a 3.0% gain in February. The reading was higher than the 5.1% climb anticipated by analysts. A rise of 4.3% is anticipated.
*All times are GMT.
USD/JPY Technical Analysis
Dollar/ ¥ started the week with a drop to 102, a line that didn’t appear last week. It then traded in a limited range before surging to a new multi-year high of 103.73. From there, it was a sharp fall of nearly 300 pips. A seoncd rise sent the pair to 102.60 before it fell again to close at 101.30.
Live chart of USD/JPY:
[do action=”tradingviews” pair=”USDJPY” interval=”60″/]- Technical lines from top to bottom
108.60 capped the pair in 2008 and worked as support during 2006. 107.16 provided support in 2007 and later worked as resistance in 2008.
105.50 is above the round number of 105 and worked as resistance during 2008. It worked as support later in the year. Below, 104.60 slowed the pair’s rise in early 2008.
103.73 is the new multi-year high and is now the key line to a fresh upside move. 102.80 capped the pair in May 2013, and could work as the immediate pullback line.
The round number of 102 provided support for the pair towards the end of May 2013 and is minor resistance now.. The 101.44 line, which was the post crisis high seen in April 2009, is now critical support.
The crash low of 100.66 provides support before 100. The obvious number below is the very round number of 100 and would be closely watched on any drop. 98.90 capped the pair in June 2009 and serves as minor resistance.
A stronger line is the 97.80 line, which was a peak back in 2009 and was reached in April 2013. The pair stumbled below this line, which is getting weaker. The round 97 line worked as important support in May 2013.
The March 2013 peak of 96.71 is the next line, which now switches to support. 95.88 provided a temporary stop on the way up and was also the swing low on a fall during April. The round number of 95 is also watched by many and will remain critical support on a reversal.
I turn from neutral to bullish on USD/JPY
The recent shocks probably served as a consolidation and correction phase before the next move higher. The extreme policies of the government and the central bank are likely to drive the yen lower. The BOJ will probably do whatever it can to lower bond yields, and this in turn will likely turn into yen weakness. While these policies might be dangerous, it seems that the Japanese authorities are more likely to double the bet than to retreat and make the early success a permanent one, especially if deflation continues
In the US, the Fed is more likely to taper bond buys than increase them. This will probably come later rather than sooner, giving stock markets and the economy more space to rise, but it doesn’t seem likely that the Fed will increase QE, especially in light of the recent signs of improvement.
More: An end to QE and what it means for Forex – by Justin Pugsley, about which currencies are set to gain and which to lose.
Further reading:
- For a broad view of all the week’s major events worldwide, read the USD outlook.
- For EUR/USD, check out the Euro to Dollar forecast.
- For GBP/USD (cable), look into the British Pound forecast.
- For the Australian dollar (Aussie), check out the AUD to USD forecast.
- For USD/CAD (loonie), check out the Canadian dollar forecast