EUR/USD had its moments of recovery, but eventually closed the week at new lows. Is the round number of 1.25 a bottom, or just another stepping stone on the way down? Yet another speech from Draghi as well as some important German data dominates this week’s trading. Here is an outlook on the highlights of this week and an updated technical analysis for EUR/USD.
Despite rock bottom inflation levels, Draghi did not rock the boat in the ECB meeting. While providing some details about the ABS, he did not seem very worried and the result was a stronger euro. On the other side of the Atlantic, data began looking sour and markets finally corrected. However, the impressive Non-Farm Payrolls report sent the pair to fresh 2 year lows. Let’s start
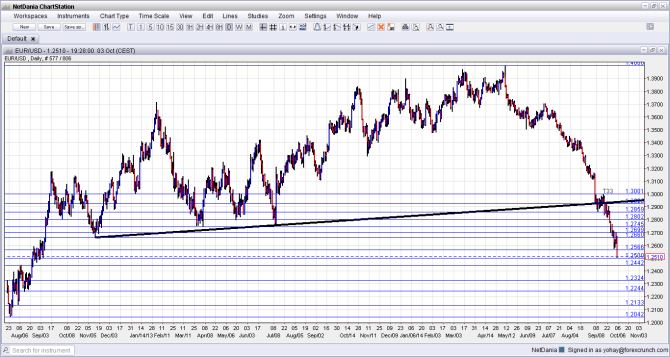
[do action=”autoupdate” tag=”EURUSDUpdate”/]EUR/USD daily chart with support and resistance lines on it. Click to enlarge:
- German Factory Orders: Monday, 6:00. While being a volatile indicator, the level of orders in Europe’s powerhouse is critical to the euro. After a surge of 4.6% in July, a correction with a slide of 2.4% is likely for August.
- Retail PMI: Monday, 8:10. This indicator for the retail sector surveys purchasing managers’ in the euro-zone’s three largest countries. The index fell deeper into contraction territory last month, to 45.8 points. Another slide cannot be ruled out now.
- Sentix Investor Confidence: Monday, 8:30. This wide survey of 2800 analysts and investors disappointed with a plunge to negative ground last month: -9.8 points. Pessimism is expected to prevail with another dip to -11.8 points.
- German Industrial Production: Tuesday, 6:00. Industrial production rose by a strong 1.9% in July, beating estimates and providing hope for a return to growth in Q3. However, expectations for August are lower – a drop of 1.4% is expected.
- German Trade Balance: Thursday, 6:00. One of the reasons why the euro was bid for such a long time is the fact that inflows come into the zone via Germany’s huge trade surplus that reached an impressive 22.2 billion euros in July. A slide to 18.4 is expected for August, despite the more favorable exchange rate.
- French Trade Balance: Thursday, 6:45. On the other hand, France suffers fro a chronic trade deficit and this is expected to grow from 5.5 to 5.7 billion. France is in the spotlight of late, mostly due to the recent political crisis.
- ECB Monthly Bulletin: Thursday, 8:00. One week after the rate decision, the European Central Bank releases the data it used for its decision. The outlook for inflation is the most important part, given the Bank’s mandate.
- Mario Draghi talks: Thursday, 15:00. The president of the ECB gives a high profile speech in Washington around the IMF meetings. Draghi always has an influence on markets, even when he only reiterates previous statements.
- French Industrial Production: Friday, 6:45. France saw two consecutive months in a row, but it is now expected to report a slide in production for the month of August: 0.2%.
* All times are GMT
EUR/USD Technical Analysis
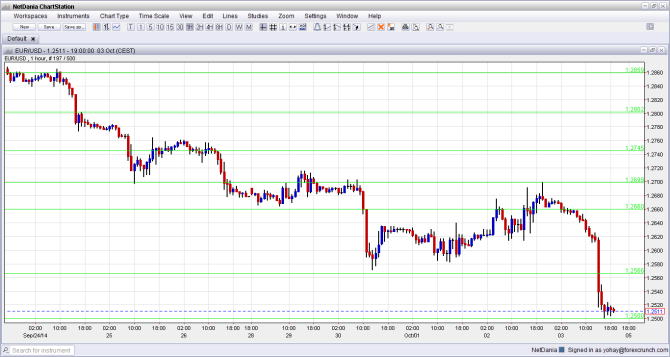
Euro/dollar began the week by trading between the 1.2660 and 1.27 levels (discussed last week). When it lost 1.2660, the fall was certainly painful and the new low is 1.2572. However, a gradual recovery followed and the pair eventually returned to the previous range, but a last collapse sent it to the verge of losing 1.25.
Live chart of EUR/USD: [do action=”tradingviews” pair=”EURUSD” interval=”60″/]
Technical lines from top to bottom:
We begin with the he all important figure of 1.30, which is more than a round number.
Below 1.30, we find support at 1.2960 which capped the pair’s recovery attempts after it fell to lower ground. The 1.2920 level was the initial low and has now turned into strong resistance.
1.2860 a place where the pair stopped on the way down in September, and now has the opposite role. The round number of 1.28, which also worked as support at around the same period of time is yet another line of resistance.
1.2750 was a double bottom back in July 2013. . This double bottom was breached and immediately worked as resistance. 1.27 is a round number and also worked as resistance to a recovery attempt.
This is followed by 1.2660 – a key line to the downside, which marks the beginning of long term uptrend support. Below, 1.2570 is the initial low seen in October and now a line of resistance.
The next line is critical: of 1.25, which is USD/EUR at 0.80. The pair flirted with this line. This is key support.
Even lower, 1.2445 was a swing high in August 2012 and it is followed by 1.2385, which was stubborn resistance around the same time.
1.2250 served as support several times in that summer, and 1.2170 was the “shoulder” in the inverse H&S pattern around the same time. The last line is the 2012 low of 1.2040.
Here is a closer look at the recent trading levels, using the hourly chart:
I remain bearish EUR/USD
European fundamentals are weak and lead to a weaker euro, without Draghi having to explain it. Inflation is at rock bottom levels (despite the rise in import prices due to the lower euro), growth is non-existent and unemployment remains high. The US dollar had its moment of weakness, but the excellent jobs report basically erases the doubts about a slowdown. Expectations for an early rate hike could rise with the FOMC minutes. All in all, as EUR/USD has more room to fall.
In our latest podcast, we discuss the big events for October:
Subscribe to our podcast on iTunes.
Further reading:
- For a broad view of all the week’s major events worldwide, read the USD outlook.
- For the Japanese yen, read the USD/JPY forecast.
- For GBP/USD (cable), look into the British Pound forecast.
- For the Australian dollar (Aussie), check out the AUD to USD forecast.
- USD/CAD (loonie), check out the Canadian dollar forecast
- For the kiwi, see the NZDUSD forecast.
