The Japanese yen rebounded strongly last week, as USD/JPY dropped 190 points. The pair closed at 111.56. There are seven events on this week’s schedule. Here is an outlook on the major events moving the yen and an updated technical analysis for USD/JPY.
In the US, Janet Yellen sent the US dollar on its heels, seeing the glass half empty and certainly playing down rate hike expectations. The NFP beat expectations but this didn’t bolster the greenback. Japanese Tankan indices softened in the first quarter and missed their estimates.
do action=”autoupdate” tag=”USDJPYUpdate”/]
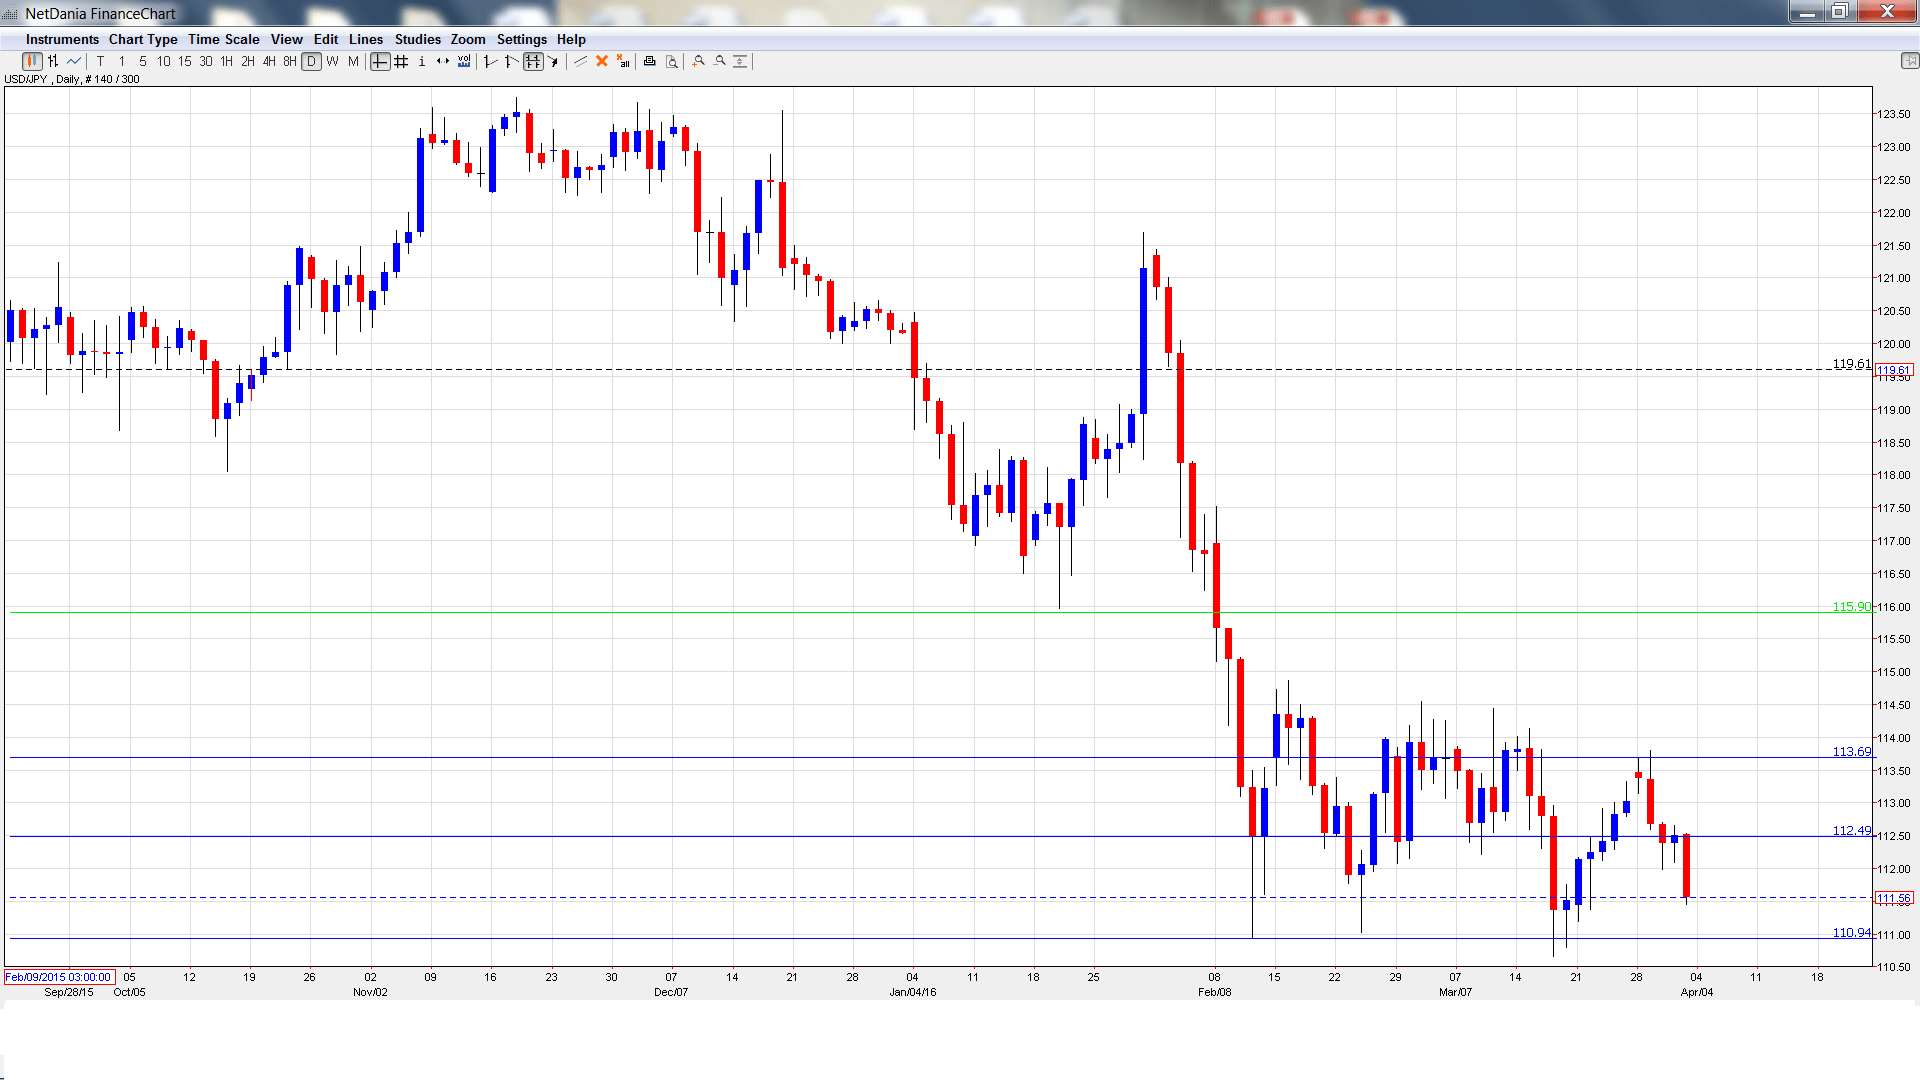
USD/JPY graph with support and resistance lines on it. Click to enlarge:
- Monetary Base: Monday, 23:50. Monetary Base was almost unchanged in February, with a reading of 29.0%. The estimate for March is 28.7%.
- Average Cash Earnings: Tuesday, 00:00. This indicator gauges changes in employment income, which is closely linked to consumer spending. The indicator improved to 0.4% in January, beating the estimate of 0.2%. The forecast for the February report stands at 0.2%.
- 10-year Bond Auction: Tuesday, 3:45. Yields on 10-year bonds have been steadily dropping, and the March yield slipped into negative territory, with a reading of -0.02%. Will the April yield remain in negative territory?
- Leading Indicators: Wednesday, 5:00. This minor event has been losing ground, dipping to 101.4% in January, which was within expectations. The downward trend is expected to continue, with an estimate of 99.9%.
- Current Account: Thursday, 23:50. Japan’s current account surplus dropped in January to 1.49 trillion yen, well short of the estimate of 1.66 trillion. The markets are expecting a rebound in February, with an estimate of 1.57 trillion yen.
- Consumer Confidence: Friday, 5:00. Japan’s weak economy has eroded consumer confidence, which dropped to 40.1 points in February, marking a 13-month low. Another weak release is expected for March, with an estimate of 40.5 points.
- Economy Watchers Sentiment: Friday, 6:00. This consumer indicator continues to indicate pessimism, with readings below the 50-point level since August 2015. The indicator slipped to 44.6 points in February, short of expectations. The estimate for the March report stands at 46.5 points.
* All times are GMT
USD/JPY Technical Analysis
USD/JPY opened the week at 113.46 and quickly touched a high of 113.80, testing resistance at 113.71 (discussed last week). The pair then reversed directions and dropped to a low of 111.45. USD/JPY closed the week at 111.56.
Live chart of USD/JPY: [do action=”tradingviews” pair=”USDJPY” interval=”60″/]
Technical lines from top to bottom:
115.90 was an important cushion in the second half of 2015.
114.65 is the next resistance line.
113.71 is an immediate resistance line.
112.48 is providing support. The line marked the start of a yen rally in January 2008, which saw USD/JPY drop below the 100 level.
110.94 is a weak support line. It was a cushion February.
109.81 is the next support line.
108.95 was a cushion in May 2006.
107.39 is the final support level for now.
I am bearish on USD/JPY
The Fed has poured cold water on speculation of an imminent rate hike, and this could continue to weigh on the dollar. The Japanese economy didn’t show any improvement after the BoJ adopted negative rates, and a lack of effective easing measures means that the yen could continue to improve.
In our latest podcast we explain why the doves do NOT cry.
Follow us on Sticher or on iTunes
Further reading:
- For a broad view of all the week’s major events worldwide, read the USD outlook.
- For EUR/USD, check out the Euro to Dollar forecast.
- For the Japanese yen, read the USD/JPY forecast.
- For GBP/USD (cable), look into the British Pound forecast.
- For the Australian dollar (Aussie), check out the AUD to USD forecast.
- For the kiwi, see the NZDUSD forecast.
