USD/JPY posted strong gains last week, climbing 150 points. The pair closed just above the 113 line. This week’s key events are the Tankan Indexes. Here is an outlook on the major events moving the yen and an updated technical analysis for USD/JPY.
The US dollar moved higher ground thanks to hawkish comments released by various Fed officials, leaving an April hike a real possibility and contrasting the very dovish sentiment aired in the Fed statement from the previous week. US Final GDP beat expectations with a gain of 1.4% in the four quarter. Japanese inflation levels remained weak, with Tokyo Core CPI coming in at -0.3%.
do action=”autoupdate” tag=”USDJPYUpdate”/]
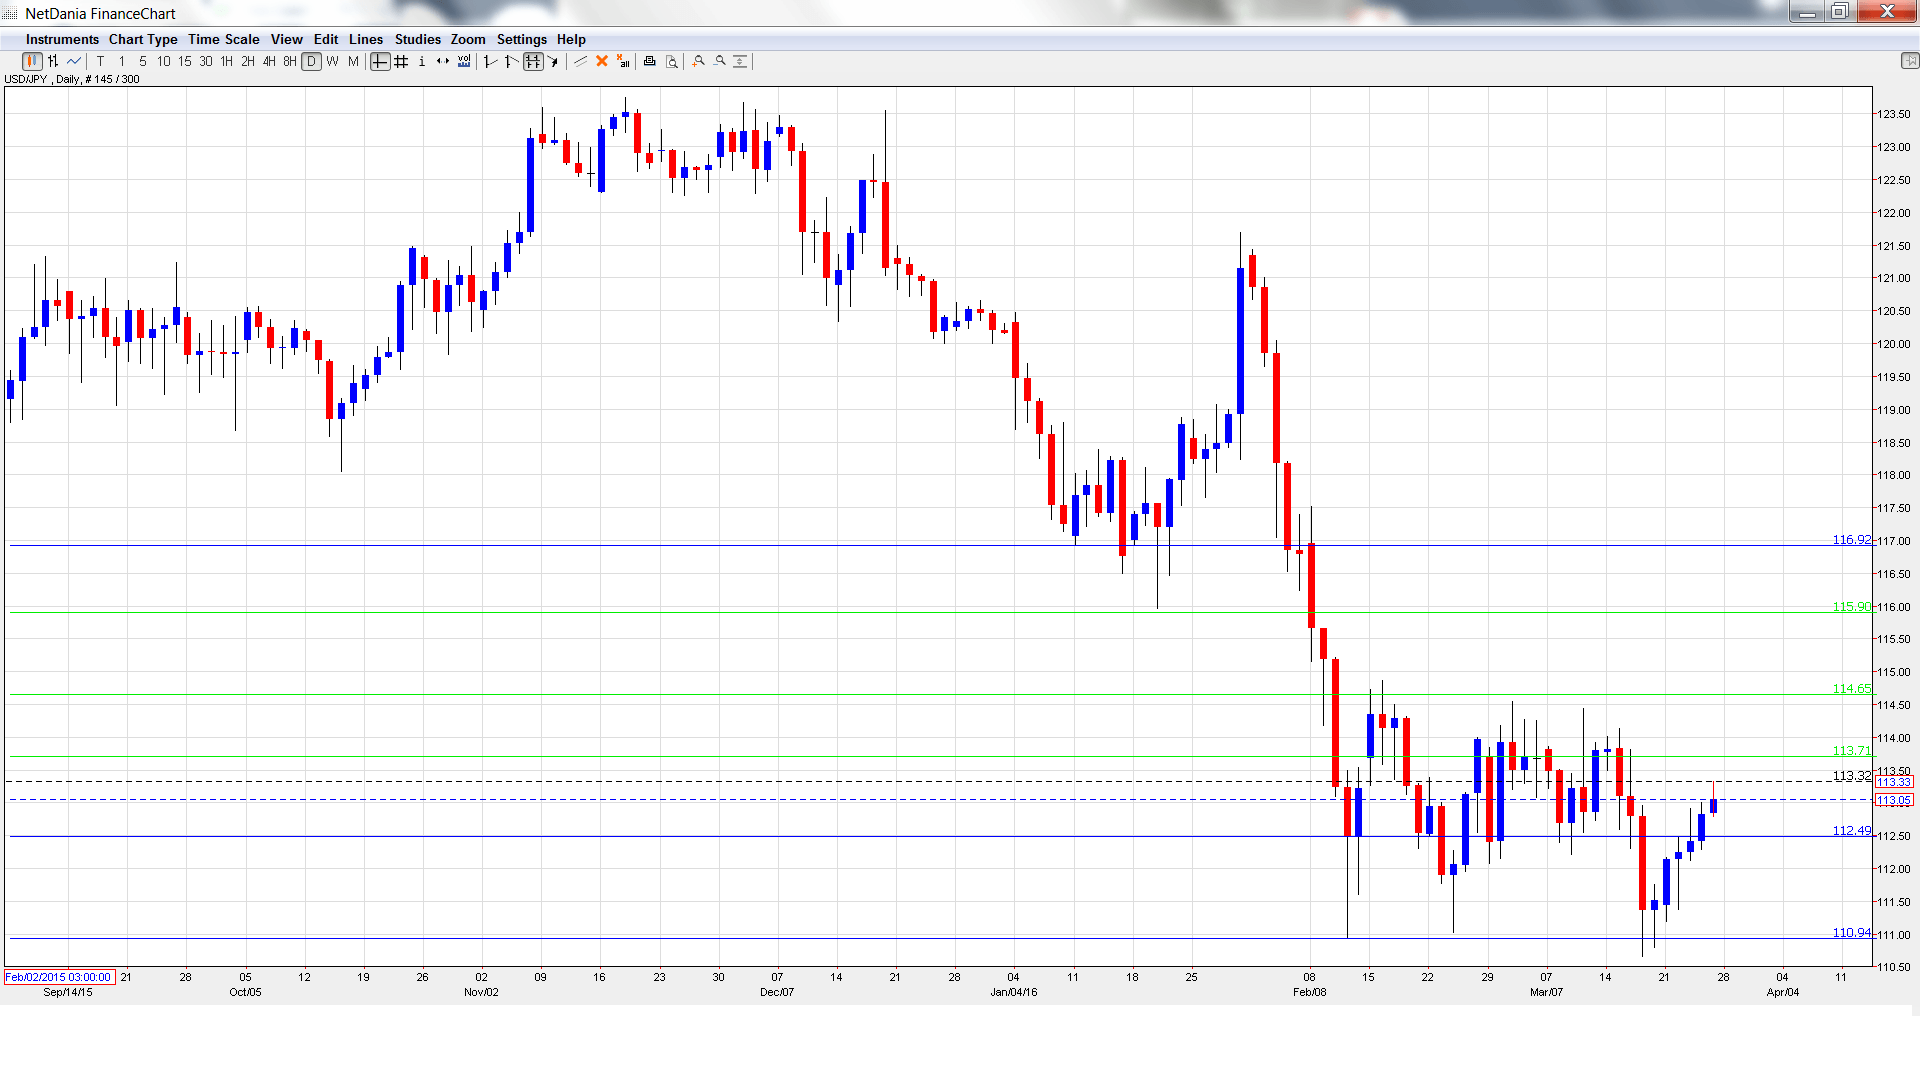
USD/JPY graph with support and resistance lines on it. Click to enlarge:
- Household Spending: Monday, 23:30. The week kicks off with this important consumer spending indicator. The indicator has posted gains for five consecutive months, and the downward trend is expected to continue in February, with the estimate standing at -1.8%.
- Retail Sales: Monday, 23:50. Retail Sales is the primary gauge of consumer spending, and an unexpected reading can have a sharp impact on the movement of USD/JPY. The indicator has managed to post just one gain since September. The markets are expecting much better news in the February report, with an estimate of 1.6%.
- Preliminary Industrial Production: Tuesday, 23:50. This manufacturing indicator rebounded sharply in January, with an excellent gain of 3.7%. However, the markets are bracing for a steep decline in the February report, with an estimate of -5.7%.
- Housing Starts: Thursday, 5:00. This is the key event of the week. Housing Starts provides a snapshot of the strength of the housing sector. The indicator improved in January, posting a small gain of 0.2%. However, the markets are braced for a sharp decline in February, with an estimate of -2.2%.
- Tankan Manufacturing Index: Thursday, 23:50. The Tankan indices are similar to the key PMI reports published in the US and elsewhere, and are released once every quarter. This index has been steady, posting readings of 12 points in 4 of the past 5 months. The markets are expecting a softer reading in Q1, with an estimate of 8 points.
- Tankan Non-Manufacturing Index: Thursday, 23:50. This indicator has posted two straight readings of 25 points, pointing to improving conditions in the services sector. Another strong reading is expected in Q1, with a forecast of 23 points.
- Final Manufacturing PMI: Friday, 2:00. The index dipped to 50.1 points in February, within expectations. The downward trend is expected to continue in March, with an estimate of 49.1 points, indicative of slight contraction.
* All times are GMT
USD/JPY Technical Analysis
USD/JPY opened the week at 111.44 and quickly dropped to a low of 111.20, as support held at 110.94 (discussed last week). The pair then reversed directions and climbed all the way to 113.22. USD/JPY closed the week at 113.05.
Live chart of USD/JPY: [do action=”tradingviews” pair=”USDJPY” interval=”60″/]
Technical lines from top to bottom:
116.90 supported dollar/yen early in 2015.
115.90 was an important cushion in the second half of 2015.
114.65 is the next resistance line.
113.71 is an immediate resistance line.
112.48 is providing support. The line marked the start of a yen rally in January 2008, which saw USD/JPY drop below the 100 level.
110.94 has been a cushion since early February.
109.81 is the next support line.
108.95 was a cushion in May 2006. It is the final support line for now.
I am bullish on USD/JPY
With renewed talk of a Fed rate hike as early as April, monetary divergence will make the US dollar an attractive asset. The Japanese economy is struggling, and if the Tankan indices do not meet expectations, the yen slide could continue.
In our latest podcast we crunch some commodities
Follow us on Sticher or on iTunes
Further reading:
Further reading:
- For a broad view of all the week’s major events worldwide, read the USD outlook.
- For EUR/USD, check out the Euro to Dollar forecast.
- For the Japanese yen, read the USD/JPY forecast.
- For GBP/USD (cable), look into the British Pound forecast.
- For the Australian dollar (Aussie), check out the AUD to USD forecast.
- For the kiwi, see the NZDUSD forecast.
