AUD/USD reversed directions last week and gained 100 points, as the pair closed at 0.7425. This week’s key events are Private Capital Expenditure and Retail Sales. Here is an outlook on the major market-movers and an updated technical analysis for AUD/USD.
The Australian dollar posted strong gains, as AUD/USD corrected upwards after two weeks of sharp losses. In the US, durable goods orders were sharp and UoM Consumer Sentiment beat expectations. There were no major Australian events last week.
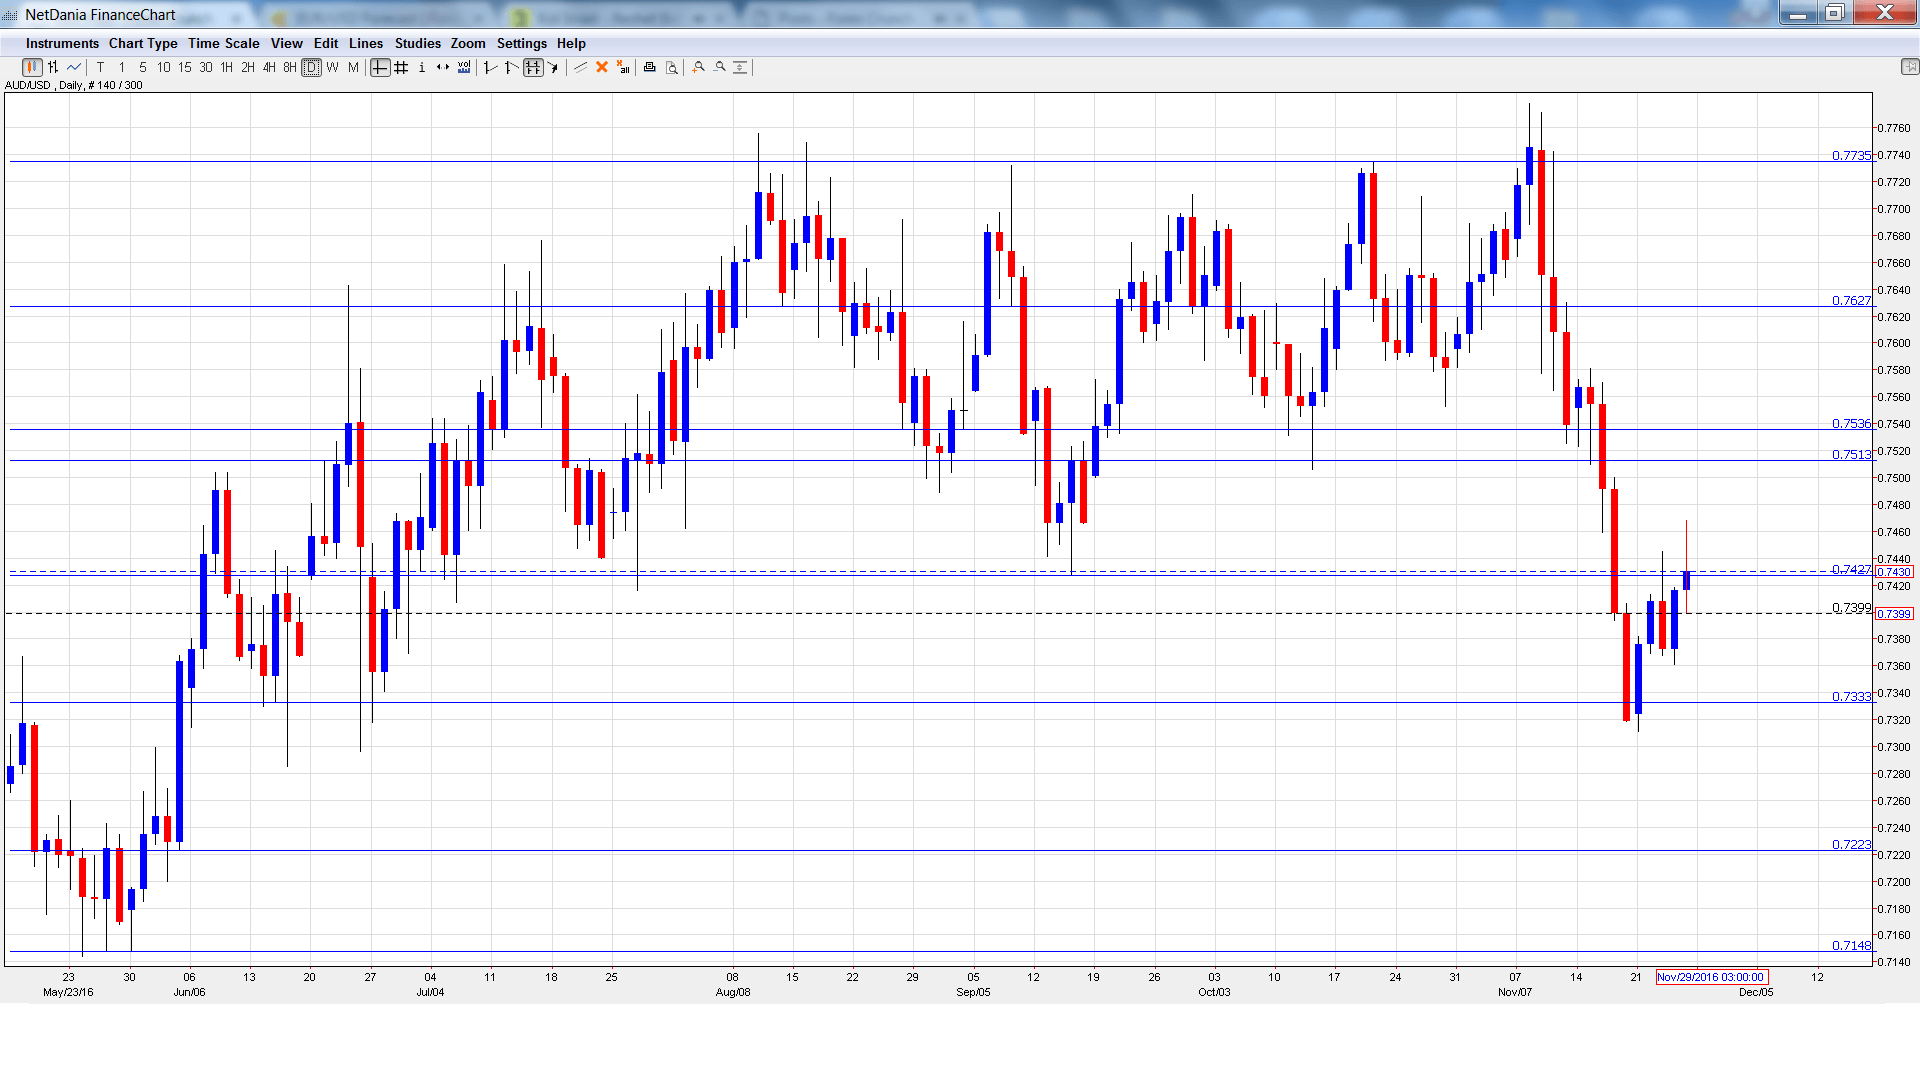
[do action=”autoupdate” tag=”AUDUSDUpdate”/]AUD/USD daily graph with support and resistance lines on it. Click to enlarge:
- HIA New Home Sales: Wednesday, 00:00. This indicator provides a snapshot of the level of activity in the housing sector. In September, the indicator posted a gain of 2.7%, down from a gain of 6.1% a month earlier.
- Building Approvals: Wednesday, 00:30. Building Approvals tends to show strong fluctuations, making accurate market forecasts a tricky task. In September, the indicator recorded a sharp decline of 8.7%, much weaker than the forecast of -.2.8%. The markets are expecting a strong turnaround in October, with an estimate of 2.2%.
- AIG Manufacturing Index: Wednesday, 22:30. The indicator continues to hover close to the 50-point level, indicative of a stagnant manufacturing sector. The index improved to 50.9 points in October.
- Private Capital Expenditure: Thursday, 00:30. This is the first key event of the week. The indicator has struggled, posting 6 declines in the past 7 quarters. Another decline is expected in the third quarter, with an estimate of -2.8%.
- Chinese Manufacturing PMI: Thursday, 1:00. The index remains close to the 50-point level, showing a stagnant manufacturing sector. Little change is expected in the November reading, with an estimate of 51.0 points.
- Chinese Caixin Manufacturing PMI: Thursday, 1:45. This indicator continues to hover close to the 50-point level. The indicator came in at 51.2, above the estimate of 50.2 points. Little change is expected in the November report.
- Commodity Prices: Thursday, 5:30. The indicator improved sharply in October, posting a gain of 16.0%. Will the upward trend continue in the November report?
- Retail Sales: Friday, 00:30. Retail Sales is one of the most important indicators and should be treated as a market-mover. In September, the indicator gained 0.6%, beating the estimate of 0.4%. The estimate for October stands at 0.3%.
AUD/USD Technical Analysis
AUD/USD opened the week at 0.7324 and dropped to a low of 0.7311, testing support at 0.7334 (discussed last week). The pair then rebounded and climbed to a high of 0.7468. AUD/USD closed the week at 0.7425.
Live chart of AUD/USD:
Technical lines from top to bottom:
With AUD/USD posting sharp losses, we begin at lower levels:
0.7737 was a cap in June 2015.
0.7626 is next.
0.7513 was a cushion in April 2015.
0.7427 marked the low point for the month of September.
0.7333 was a cap in December 2015.
0.7223 has held firm in support since June.
0.7148 is the final support level for now.
I remain bearish on AUD/USD
AUD/USD managed to reverse directions and post gains last week. However, the Aussie will likely remain under pressure, with the Federal Reserve expected to raise rates in December.
Our latest podcast is titled Eyeing OPEC – Critical crude
Follow us on Sticher or iTunes
Further reading:
- For a broad view of all the week’s major events worldwide, read the USD outlook.
- For EUR/USD, check out the Euro to Dollar forecast.
- For the Japanese yen, read the USD/JPY forecast.
- For GBP/USD (cable), look into the British Pound forecast.
- For the Canadian dollar (loonie), check out the Canadian dollar forecast.
- For the kiwi, see the NZD/USD forecast.
