USD/JPY continued to post gains last week, as the pair touched its highest levels since February. USD/JPY closed the week at 113.30. There are nine events this week. Here is an outlook for the highlights of this week and an updated technical analysis for USD/JPY.
In Japan, consumer spending numbers remain weak, as Household Spending and Retail Sales both posted declines. In the US, Preliminary GDP sparkled in Q3 with a gain of 3.2%, beating the estimate of 3.0%. Consumer Confidence data easily beat expectations. Employment numbers were mixed, as Nonfarm Payrolls met expectations, but wages declined.
do action=”autoupdate” tag=”USDJPYUpdate”/]
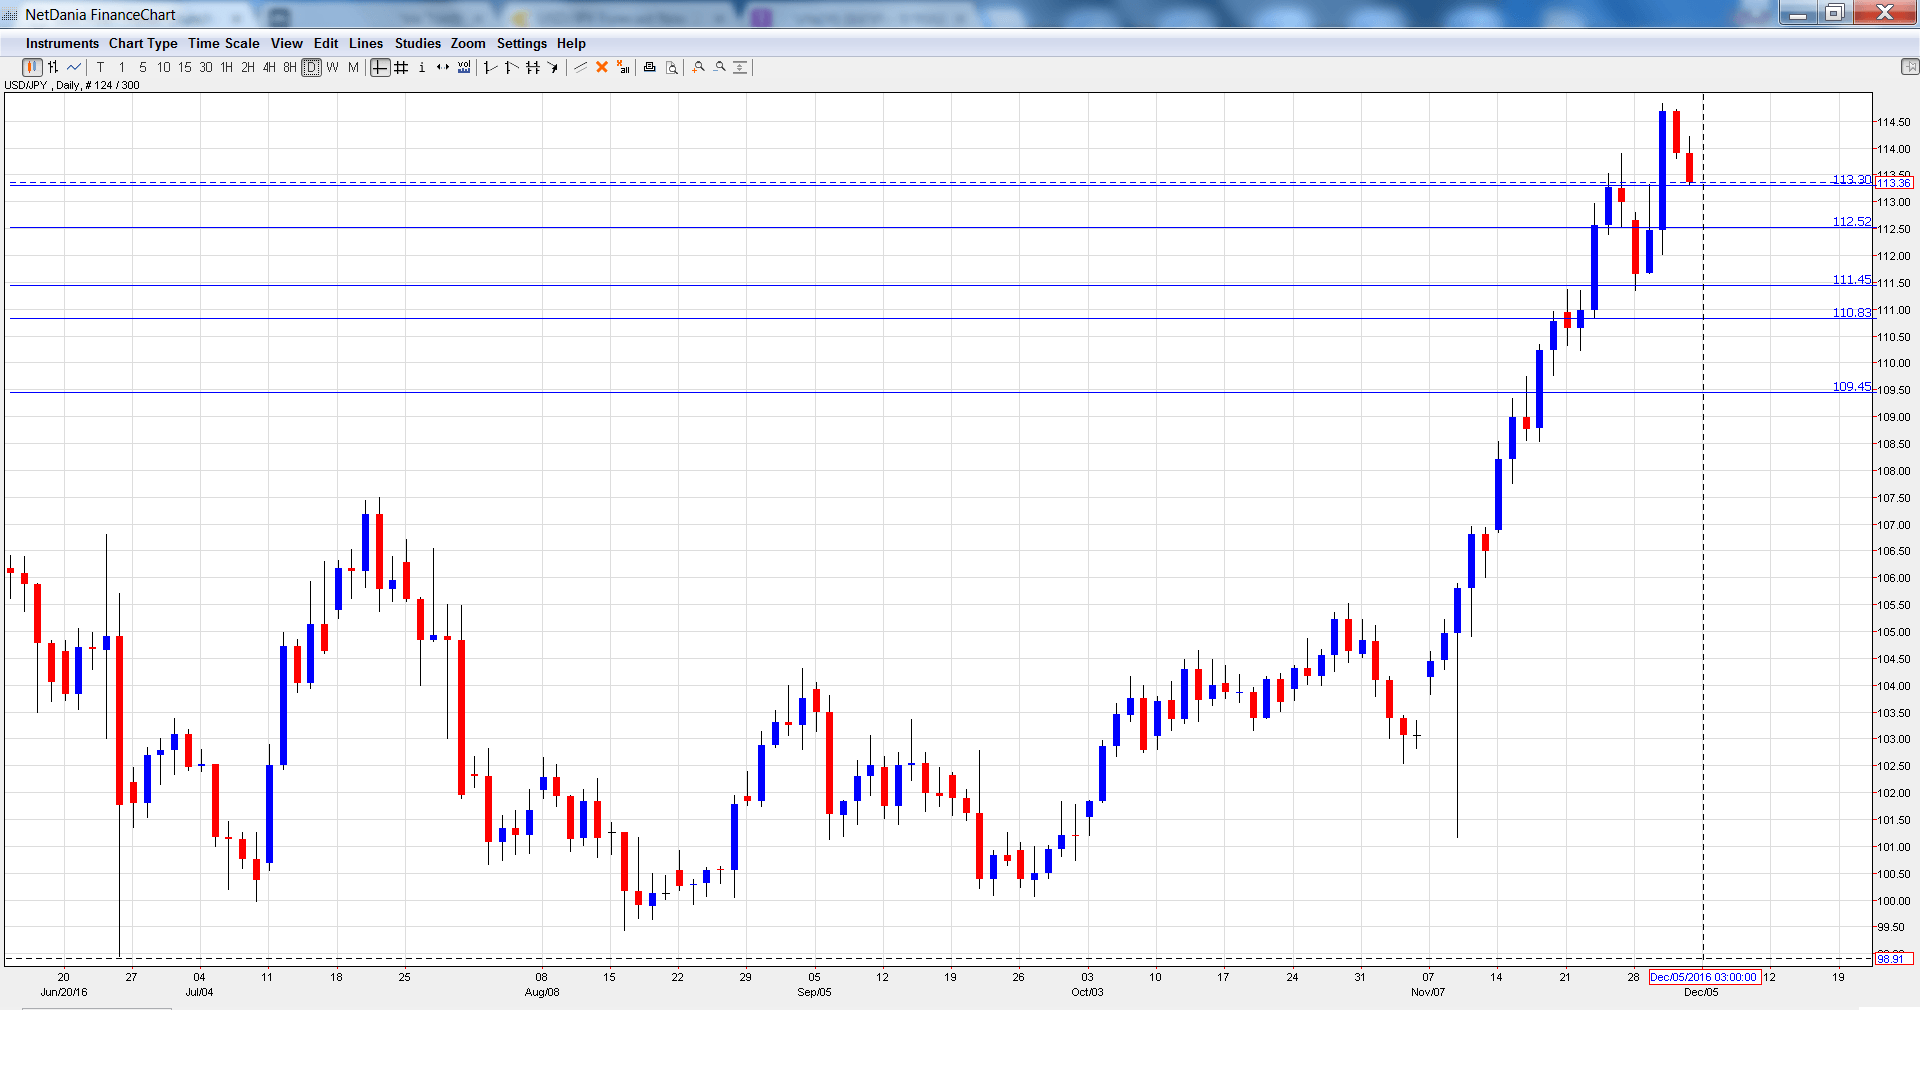
USD/JPY graph with support and resistance lines on it. Click to enlarge:
- Japanese Consumer Confidence: Monday, 5:00. Consumer Confidence continues to post weak readings, indicative of a pessimistic consumer. The October reading came in at 42.3, short of expectations. The estimate for November stands at 43.8 points.
- Average Cash Earnings: Tuesday, 00:00. This indicator is correlated to consumer spending. The September release improved to 0.2%, matching the forecast. Another reading of 0.2% is expected in October.
- Leading Indicators: Wednesday, 5:00. This minor indicator dropped to 100.5% in September, matching the forecast. The October reading is expected to improve to 101.6%.
- Current Account: Wednesday, 23:50. Japan’s current account surplus dipped to 1.48 trillion September, well short of the forecast of JPY 1.98 trillion. The surplus is expected to widen to JPY 1.57 trillion in the October report.
- Final GDP: Wednesday, 23:50. Final GDP dipped to 0.2% in Q2, although this beat the estimate of 0.0%. The markets are expecting a strong gain in Q3, with a forecast of 0.6%.
- 30-year Bond Auction: Thursday, 3:45. 3-year bonds have been steady, with three straight yields at the 0.50% level. Will we see a change at the December auction?
- Economy Watchers Sentiment: Thursday, Tentative. The indicator continues to point to pessimism, with readings well below the 50-level throughout 2016.
- BSI Manufacturing Index: Thursday, 23:50. This important manufacturing indicator rebounded in Q2, with a reading of 2.9 points. This easily beat the forecast of -6.5 points. The upward trend is expected to continue in Q3, with the estimate standing at 3.4 points.
- Preliminary Machine Tool Orders: Friday, Tentative. The indicator remains in negative territory and has posted consecutive declines since September 2015. No major change is expected in the November report.
* All times are GMT
USD/JPY Technical Analysis
The pair opened the week at 112.65 and dropped to a low of 111.35, testing support at 111.45 (discussed last week). The pair then reversed directions and climbed to a high of 114.83. USD/JPY gave up some of these gains and closed the week at 113.36.
Live chart of USD/JPY:
Technical lines from top to bottom:
With USD/JPY posting strong gains last week, we start at higher levels:
116.88 was a cap in February 2015.
115.56 was a cushion in December 2014.
114.55 marked a high point in March.
113.23 is next.
112.53 is an immediate support line. It was a cap in April 2016.
111.45 was tested in support as USD/JPY posted strong losses before rebounding.
110.83 was the start of a rally in June which saw USD/JPY drop below the 102 line.
109.46 is the final support line for now.
I am bullish on USD
With a Fed rate hike considered a virtual certainty this month, sentiment remains very positive towards the US dollar. The yen dropped about 8 percent in November and the slide could continue.
Our latest podcast is titled From the Crude Cut to Draghi’s Drag
Follow us on Sticher or iTunes
Further reading:
- For a broad view of all the week’s major events worldwide, read the USD outlook.
- For EUR/USD, check out the Euro to Dollar forecast.
- For the Japanese yen, read the USD/JPY forecast.
- For GBP/USD (cable), look into the British Pound forecast.
- For the Canadian dollar (loonie), check out the Canadian dollar forecast.
- For the kiwi, see the NZD/USD forecast.
