USD/JPY posted sharp gains for a third straight week, posting gains of 200 points. USD/JPY closed the week just shy of the 113 line. There are 8 events this week. Here is an outlook for the highlights of this week and an updated technical analysis for USD/JPY.
The US dollar continued to roll, as US numbers impressed. In the US, durable goods orders were sharp and UoM Consumer Sentiment beat expectations. In Japan, Tokyo Core CPI posted another decline, as the Japanese economy continues to grapple with deflation.
do action=”autoupdate” tag=”USDJPYUpdate”/]
USD/JPY graph with support and resistance lines on it. Click to enlarge:
- Household Spending: Monday, 23:30. This consumer spending indicator has managed just one gain in 2016 and posted a decline of 2.1% in September. The estimate for the October reading stands at -1.0%.
- Retail Sales: Monday, 23:50. Retail Sales continues to struggle and has posted seven consecutive declines, as Japanese consumers remain reluctant to spend. Another decline is expected in October, with an estimate of -1.5%.
- Preliminary Industrial Production: Tuesday, 23:50. The indicator dropped to 0.0% in September, well below the estimate of 0.9%. The markets are expecting a small gain of 0.2% in October.
- Housing Starts: Wednesday, 5:00. This indicator provides a snapshot of the level of activity in the housing sector. In September, the indicator posted a strong gain of 10.0%, well above the forecast of 5.3%. Another solid gain is predicted for October, with an estimate of 11.5%.
- Capital Spending: Wednesday, 23:50. Capital expenditures by businesses dipped to 3.1% in Q2, missing the estimate of 5.6%. The markets are braced for a decline in Q3, with a forecast of -0.4%.
- Final Manufacturing PMI: Thursday, 00:30. This minor manufacturing indicator improved to 51.4 points in October, within expectations. The estimate for the November reading stands at 51.7.
- 10-year Bond Auction: Thursday, 3:45. 10-year bonds remain in negative territory and remained unchanged at -0.06% in November.
- Monetary Base: Friday, 23:50. The indicator was down slightly in October, with a reading of 22.1%. The estimate for the November reading stands at 23.2%.
* All times are GMT
USD/JPY Technical Analysis
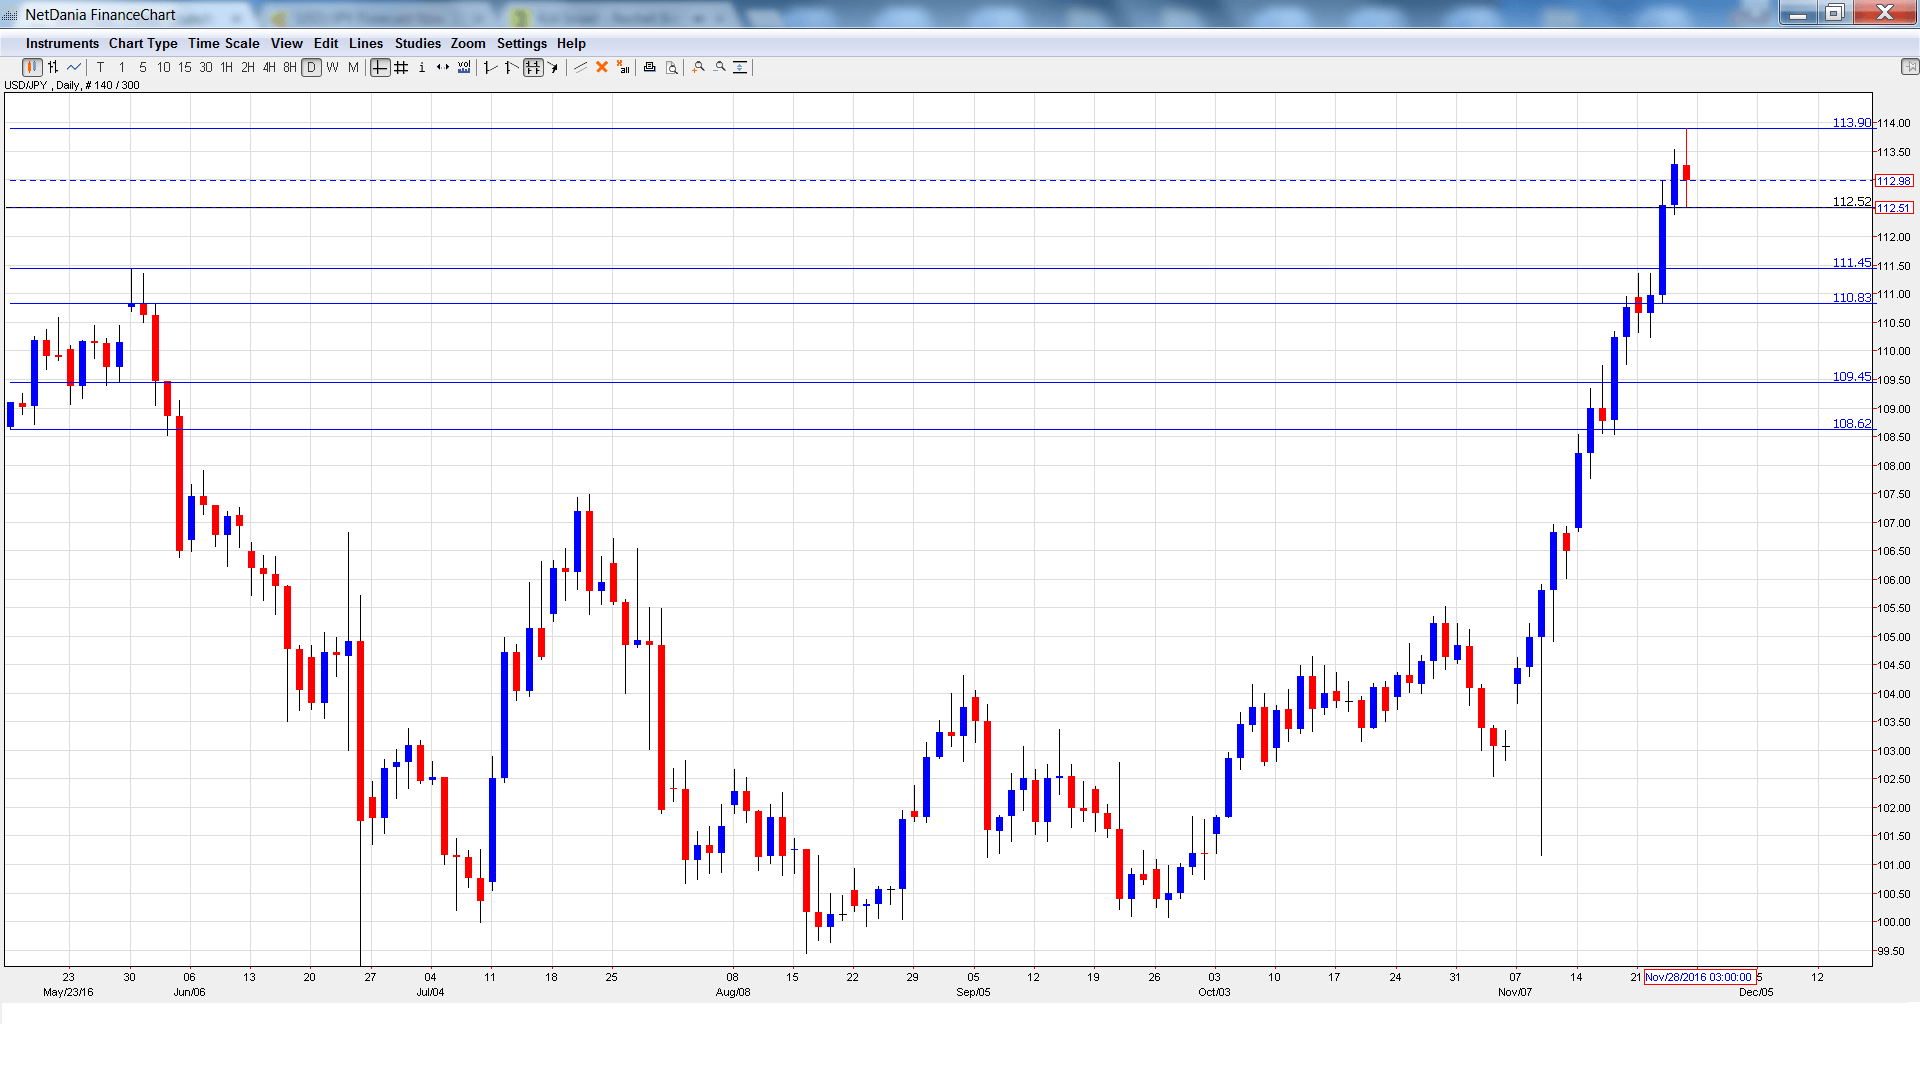
The pair opened the week at 110.94 and quickly dropped to a low of 110.24, testing support at 110.68 (discussed last week). It was all uphill from there, as the pair climbed to a high of 113.90. USD/JPY closed the week at 112.98.
Live chart of USD/JPY:
Technical lines from top to bottom:
With USD/JPY posting strong gains last week, we start at higher levels:
115.56 was a cushion in December 2014.
113.90 is the high point for November.
112.53 was a cap in April 2016.
111.45 is a weak support line.
110.83 was the start of a rally in June which saw USD/JPY drop below the 102 line.
109.46 is the next support line.
108.61 is the final support line for now.
I am bullish on USD
The US dollar has posted sharp gains against the yen in recent weeks and with a December rate hike a virtual certainty, sentiment towards the greenback is very favorable.
Our latest podcast is titled Eyeing OPEC – Critical crude
Follow us on Sticher or iTunes
Further reading:
- For a broad view of all the week’s major events worldwide, read the USD outlook.
- For EUR/USD, check out the Euro to Dollar forecast.
- For the Japanese yen, read the USD/JPY forecast.
- For GBP/USD (cable), look into the British Pound forecast.
- For the Canadian dollar (loonie), check out the Canadian dollar forecast.
- For the kiwi, see the NZD/USD forecast.
