- Bitcoin Cash price bounces over 5% in the latter stages of trading on Wednesday.
- A broadening wedge pattern can be seen via the 60-minute time frame.
The Bitcoin Cash price made a jump of around 5%, in the later stages of afternoon trading on Wednesday. BCH/USD was able to receive decent support at the lower trend line of the broadening wedge pattern, seen on the 60-minute time frame.
BCH/USD has been swinging between $825-905 range for the past 7 days now, narrow trading as seen with most of the other major altcoins. Over this week so far, price action has formed a broadening wedge pattern, subject to a breakout, which will likely to Bitcoin Cash out of this recent range.
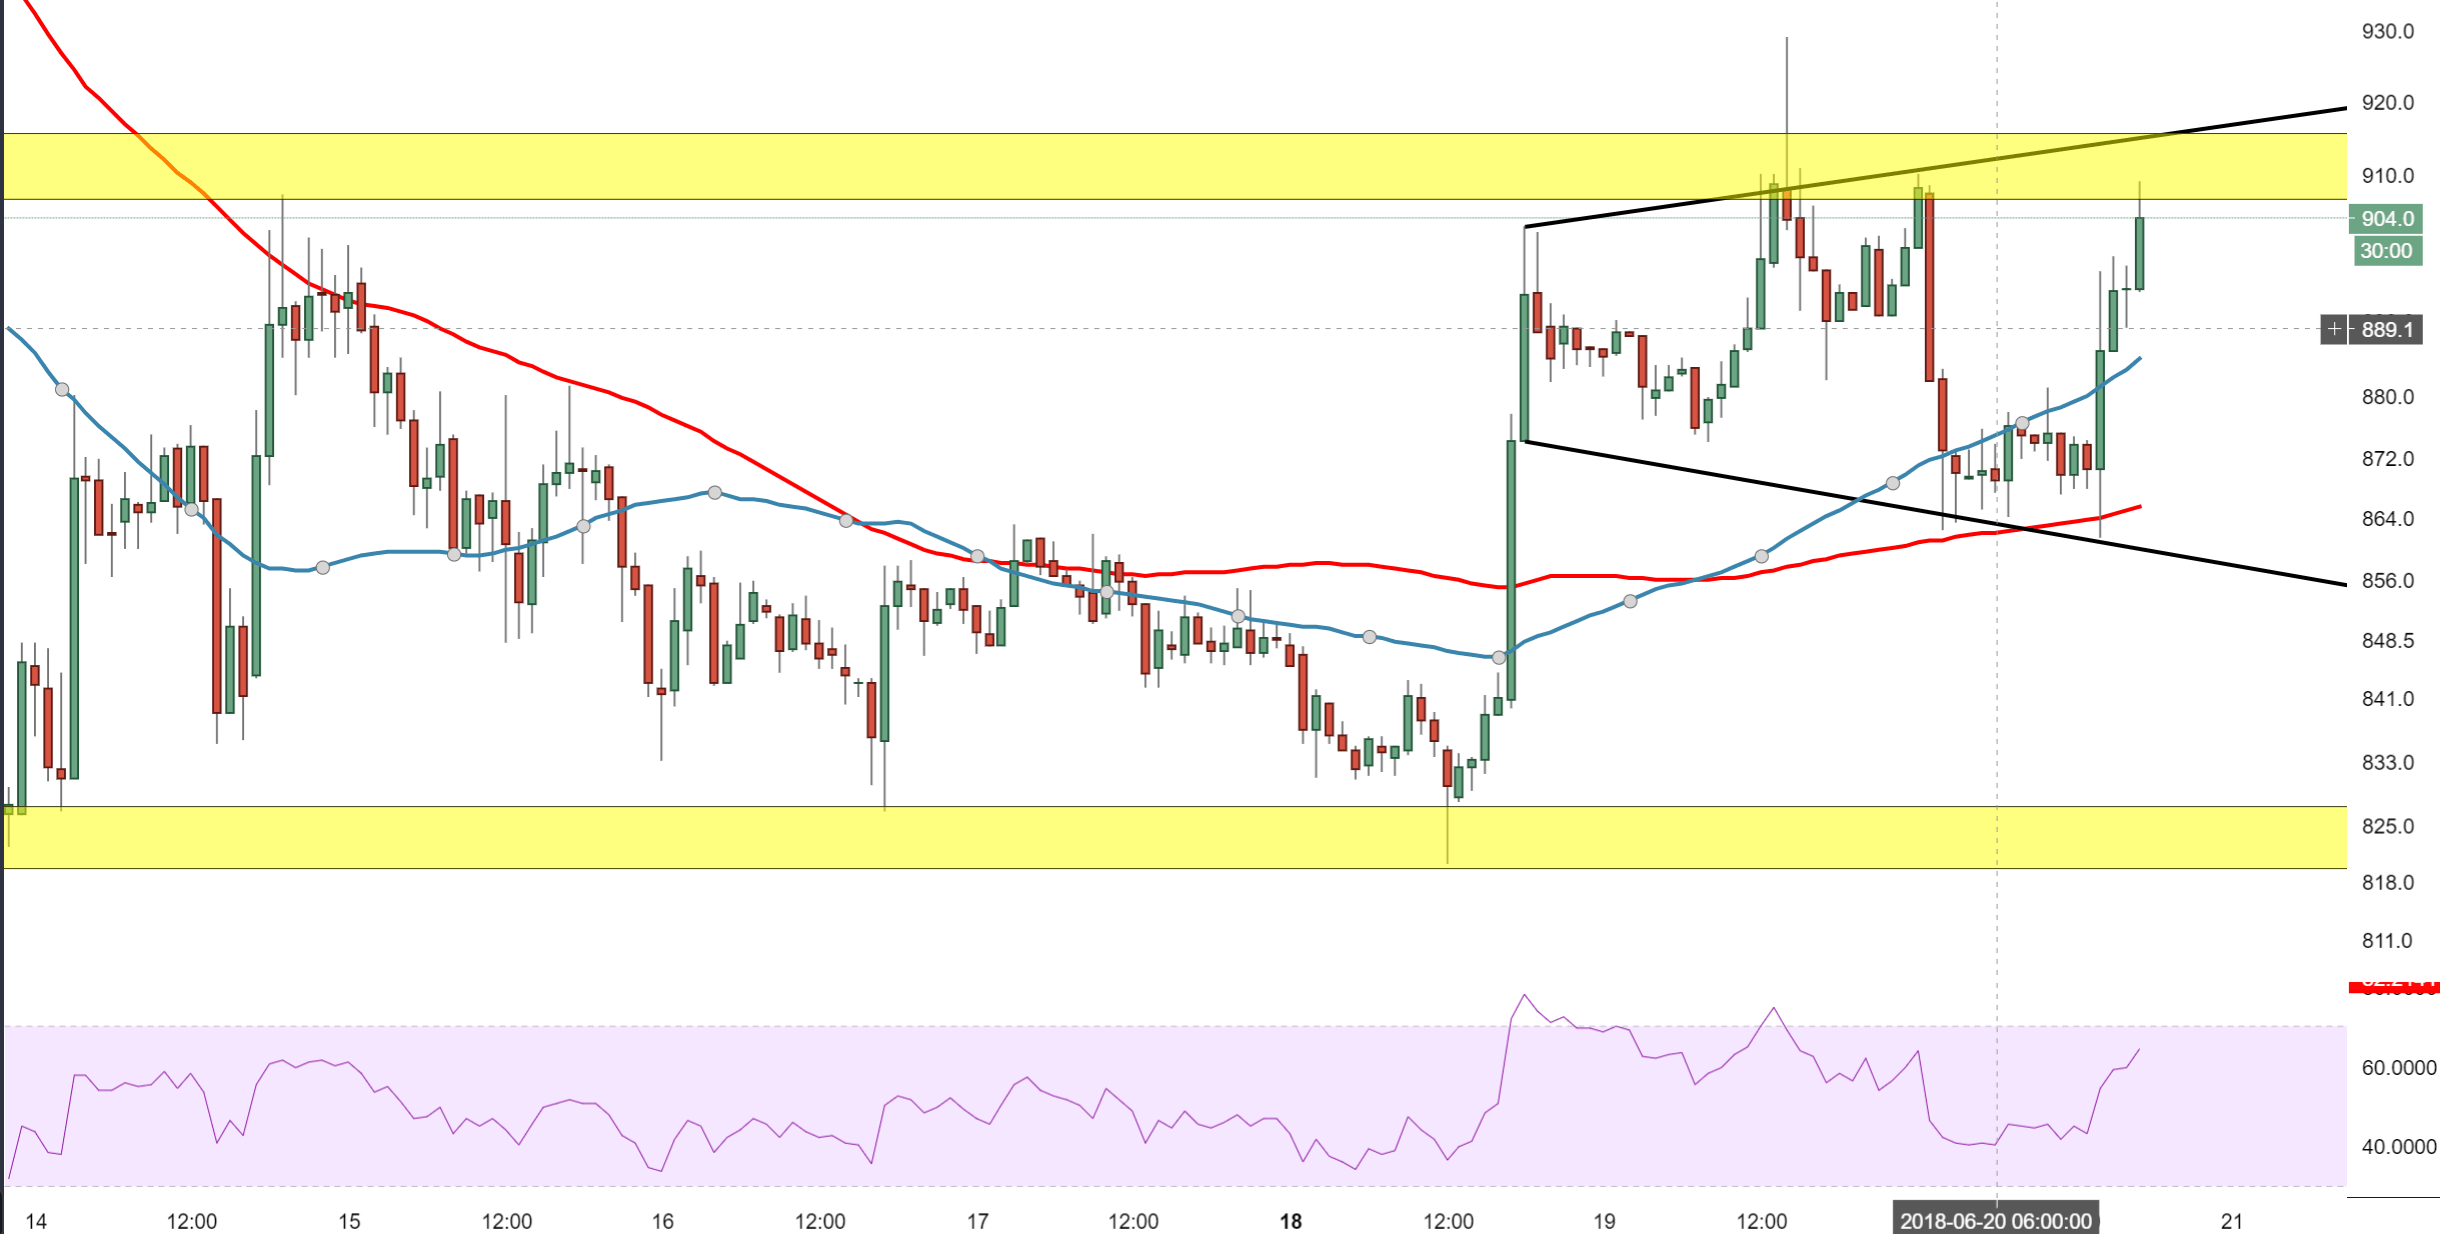
A heavy supply zone in proximity to current price action, tracking from $915-905, which has been respected for over a week now. Should the bulls manage to press ahead, it wouldn’t be too long until the price is back above the $1000 mark. Support is seen at $885, 50MA and then $860 the lower part of the wedge pattern, also where the 100MA tracks.
BCH/USD 60-minute chart