- Ethereum price is moving within a descending wedge pattern, subject to a breakout, if the upside maintains momentum.
- The short-term bull run has slowed down on Monday, despite bouncing, should support at $450 fail to hold, it could invite a large amount of selling again.
ETH/USD 30-minute chart
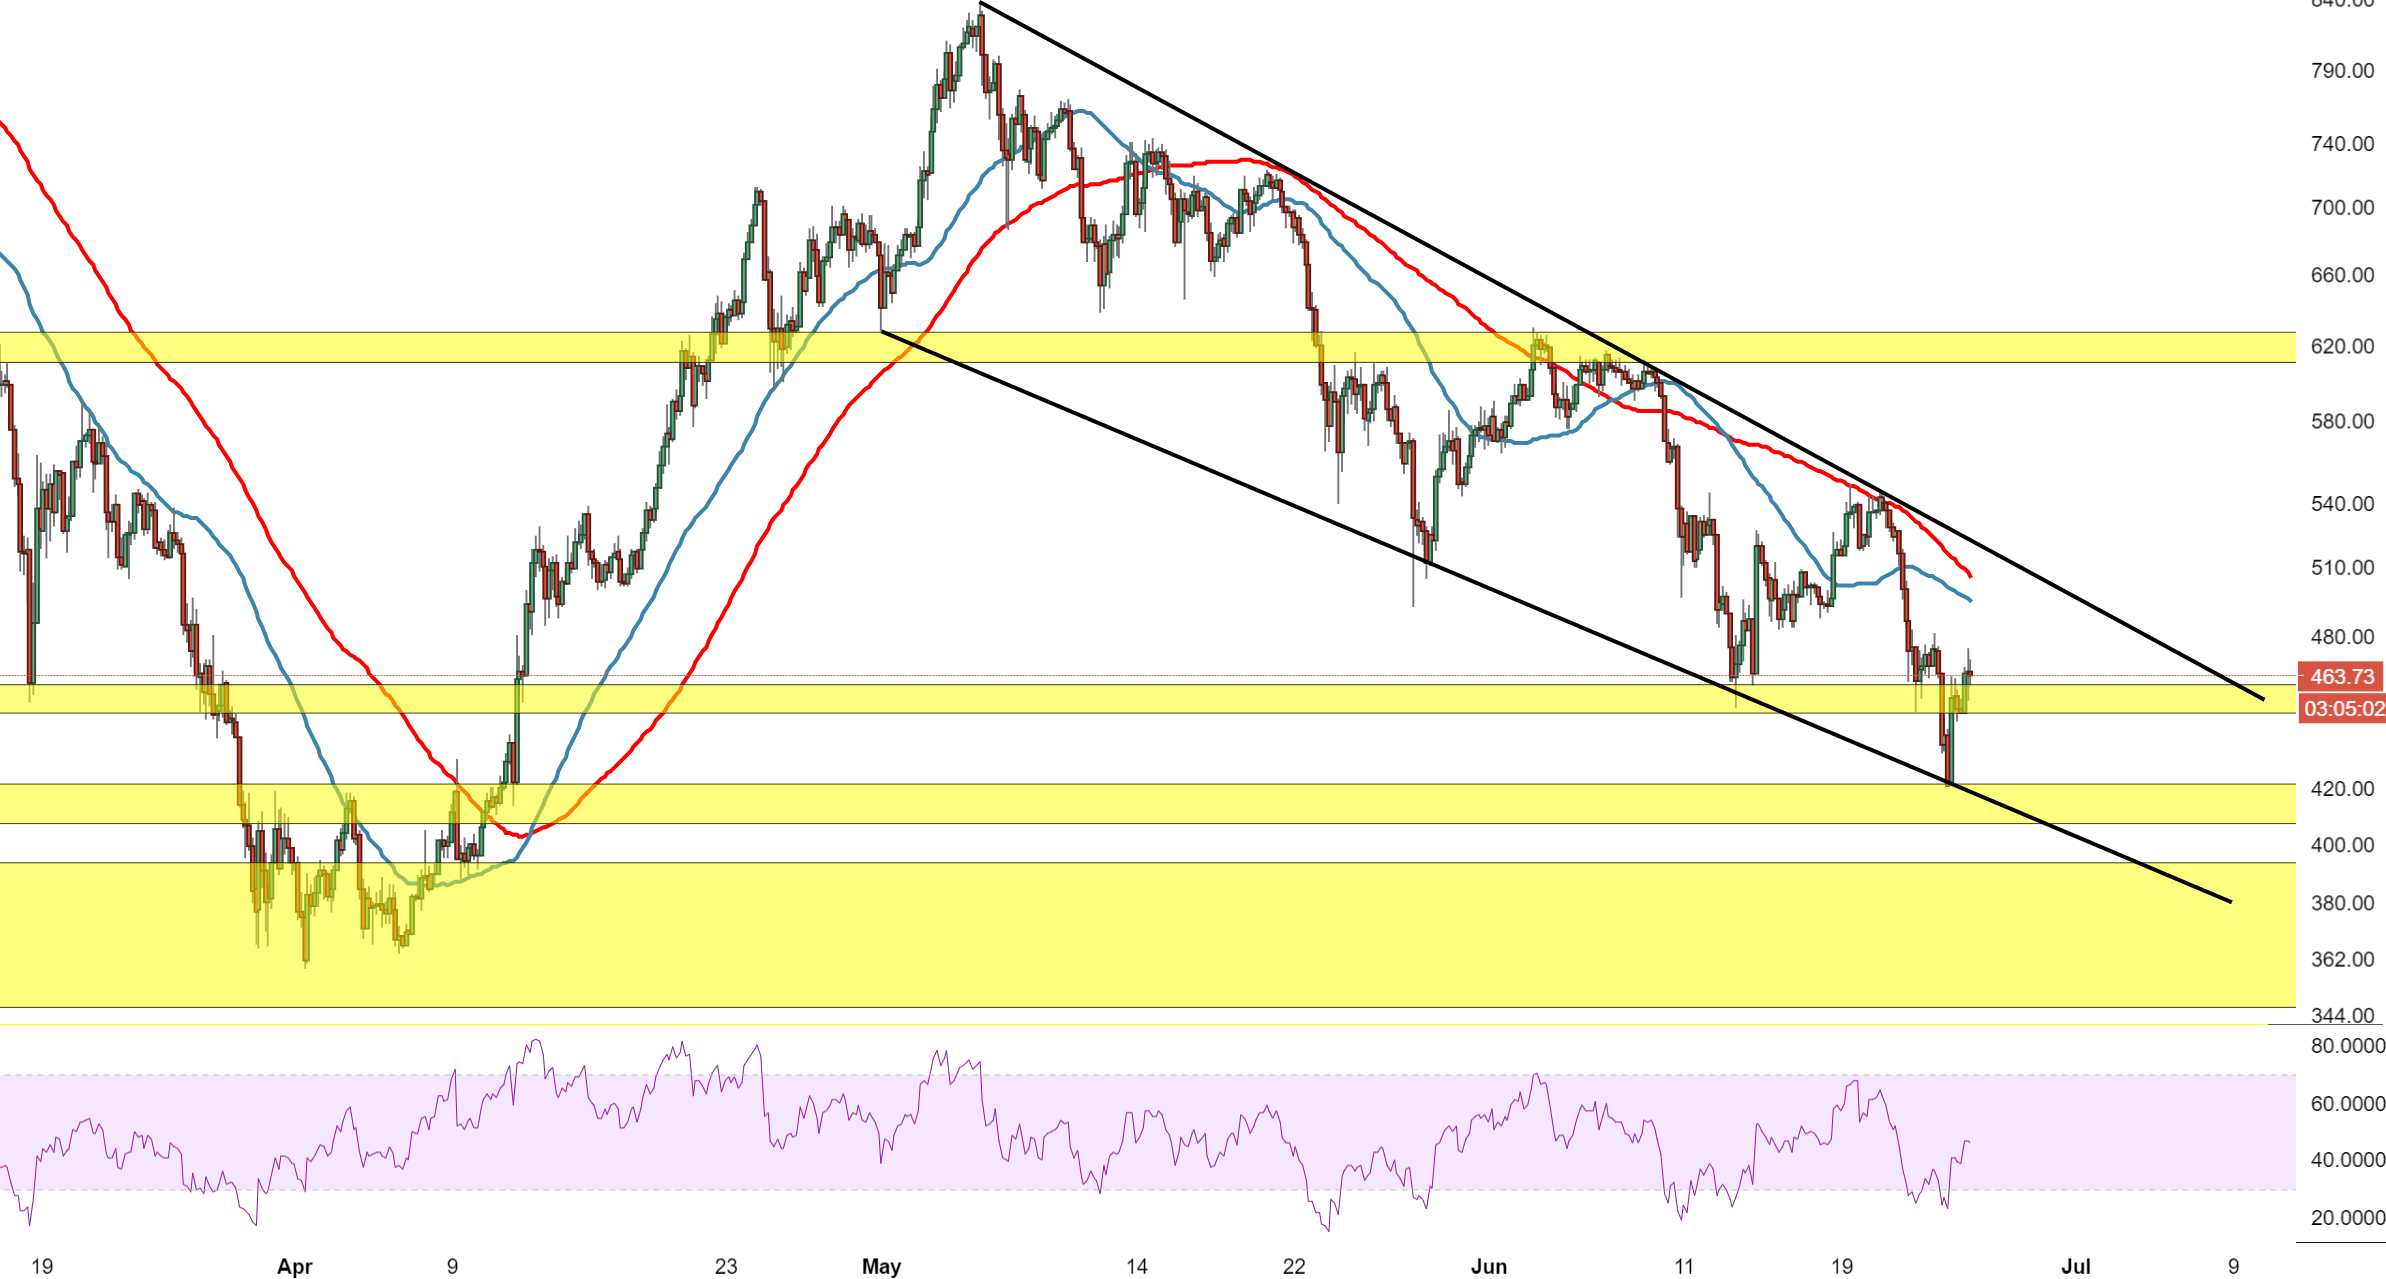
Spot rate: 463.50
Relative change: +1.80%
High: 474.42
Low: 445.30
Trend: Bullish/Neutral
Resistance 1: 479.50, (resistance on 4-hour chart).
Resistance 2: 495.38, 50MA.
Resistance 3: 506.10, 100MA.
Support 1: 450.25, demand zone.
Support 2: 415.00, lower trend line of descending wedge pattern.
Support 3: 490.50, demand zone entry.
