- Bitcoin price was seen down as much as 5% during the session on Monday, failing to sustain the upside momentum seen at the back end of last week.
- BTC/USD price clears near-term vital demand zone, which was tracking from $7900-7840.
BTC/USD 60-minute chart
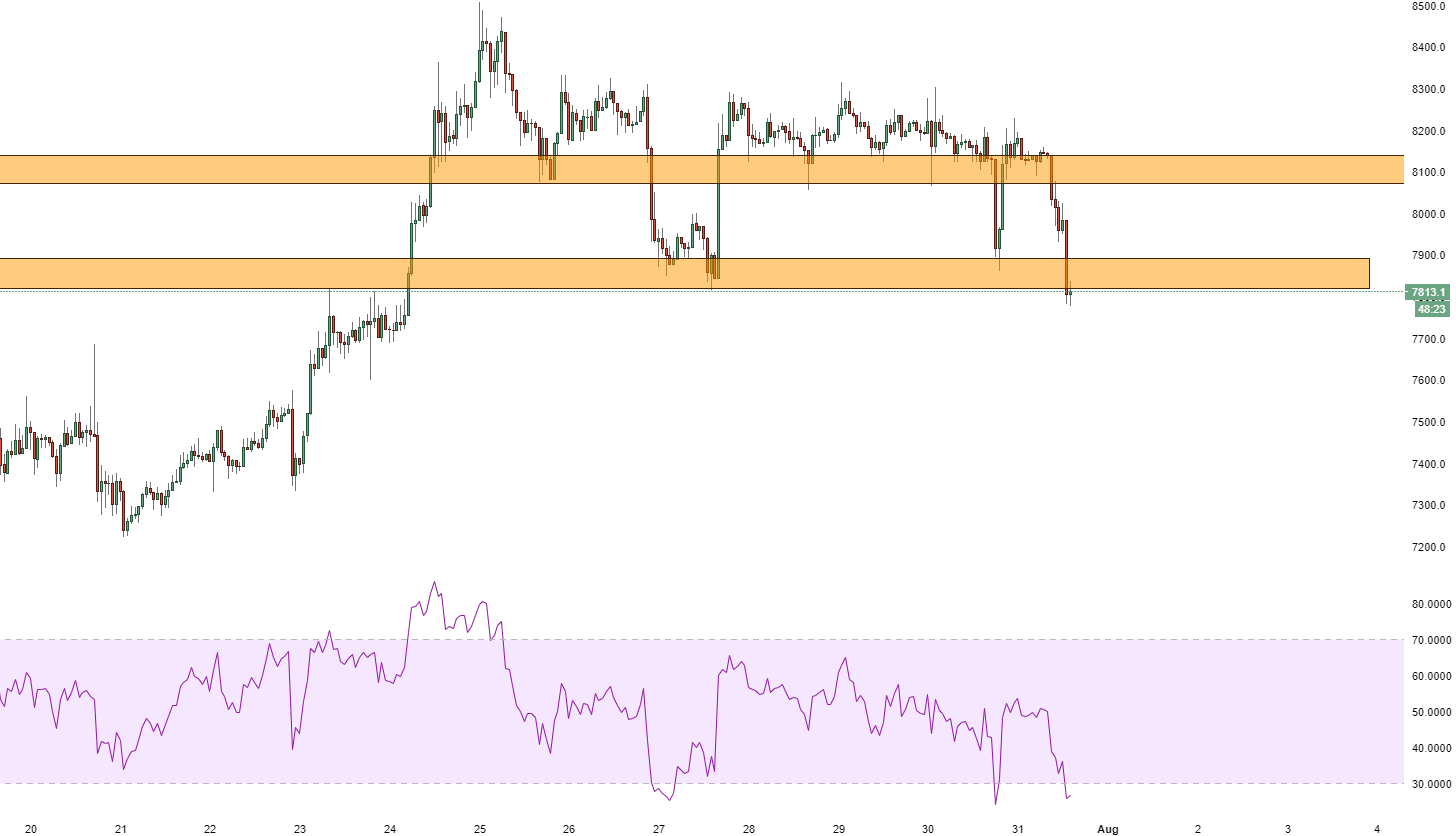
Spot rate: 7831.3
Relative change: -4.25%
High: 8178.9
Low: 7780.0
Trend: Bearish
Support 1: 7812.0, top area seen on 23rd July.
Support 2: 7687.3, consolidation area.
Support 3: 7337.1, 22nd July.
Resistance 1: 7815.1, 27th July low.
Resistance 2: 7845.1, previous demand zone.
Resistance 3: 7993.8, supply zone entrance.
