- Ripple has resumed the uptrend towards $0.350; besides it up 1.5% on a daily basis.
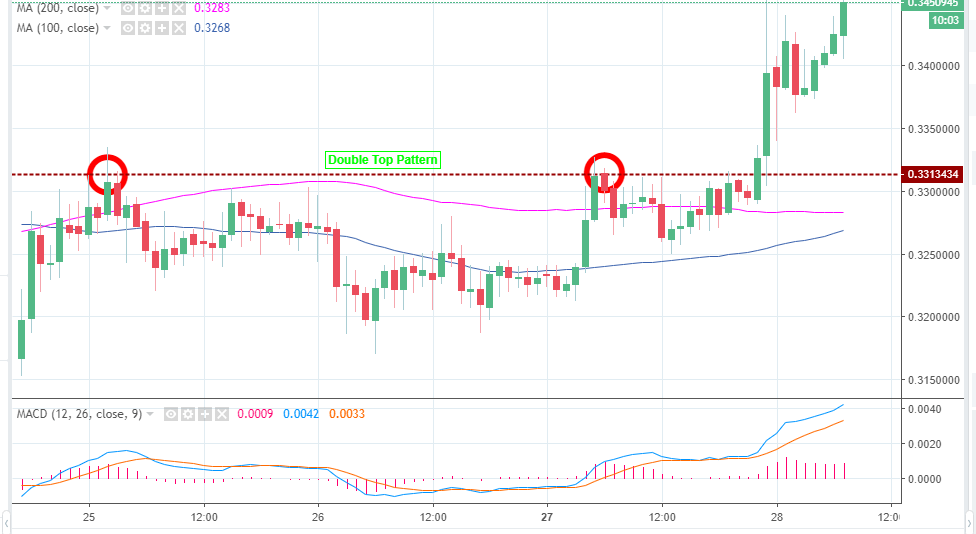
- The 50SMA will offer support at $0.3284 and the 100SMA at $0.3268.
Ripple formed a subtle double-top pattern during yesterday’s trading sessions. An analysis published by FXStreet indicated that the crypto would trim gains towards the support at $0.320. However, this did not happen and XRP/USD found a support at $0.3250 where the bulls entered pushing the price higher towards the resistance at $0.33.
There was a breakthrough above $0.330 defying the double top pattern. A pullback occurred into a couple of engulfing candles. The price struggled with the resistance at $0.340 but the bulls have maintained being control. At present, Ripple is changing hands at $0.3450 while the trend is strongly bullish.
Ripple is likely to break past the stubborn resistance at $0.350 in the short-term. The MACD momentum indicator is advancing further into the positive region (but currently at $0.0042). The 50SMA (1-hour chart) is above the long-term 100SMA to show that the trend is in favor of the buyers. If the price makes it above $0.350, it will bring $0.40 in sight. A support above this level will be very instrumental as well.
On the flip side, the initial support is at $0.340 while the resistance turned support at $0.330 will come in handy in the event an extended trend reversal occurs. Further down the 50SMA will offer support at $0.3284 and the 100SMA at $0.3268.
XRP/USD 1-hour chart