- Ethereum made a proper recovery towards $300 but formed a high at $297.18 before starting lower corrections.
- A break above $294 – $296 bearish range has to occur for sustained gains above $300.
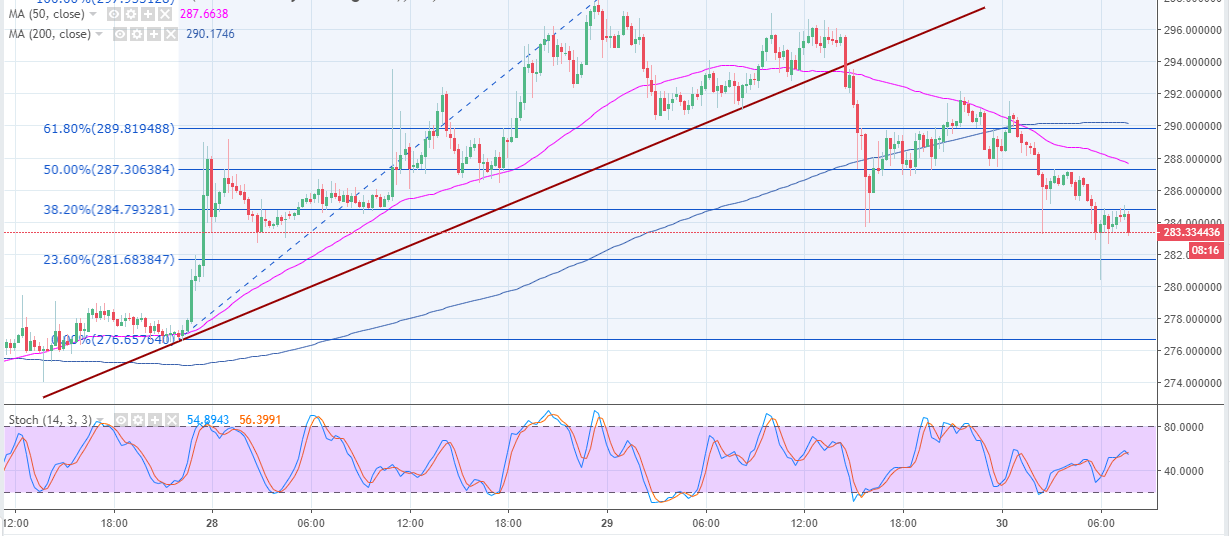
The trading yesterday witnessed an awesome upside movement heading towards $300 but formed a high at $297.18 before correcting lower. The declines progressed below $288 and even broke the 50% Fib retracement level of the last high at $297.95 and a low of $276.65. During the decline, the price also broke the bullish trendline with a support at $293.83.
Ethereum formed a low around $284 before the buyers began to enter. Subtle higher corrections followed with ETH/USD trading above $290 but the resistance at $292 overwhelmed the buyers. Ethereum is currently trading at $284 while supported at $283.00 – $282.00. The immediate resistance is at the 38.2% Fib level.
The support at $280 is very essential to the buyers. If broken, Ethereum could decline to test the swing low support at $276.65 and further breakdown to the stronger support at $270 will be imminent. On the upside, the hourly 50SMA currently at $287.59 and the 100SMA at $290.08 will prevent the pullback towards the critical resistance at $300.
A broader look at the chart shows that a bearish trend is testing $283.00 – $282.00. There is a high chance of a reversal occurring above $290. However, a break above $294 – $296 bearish range needs to occur for sustained gains above $300.
ETH/USD hourly chart