- Aave price seems to be contained inside an ascending wedge on the 4-hour chart.
- The digital asset is close to hitting $100 but some indicators show it might be poised for a pullback first.
Aave has been inside a robust uptrend since its token swap from LEND to AAVE on October 20. The digital asset is now on the verge of hitting $100 for the first time since its swap but there is one indicator that suggests it could be on the verge of a correction.
Aave price is on the cusp of a breakout or breakdown
On the 4-hour chart, Aave has established an ascending wedge that is on the verge of a breakout or breakdown. The current Aave price of $91 is right in the middle of the pattern which doesn’t favor either side.
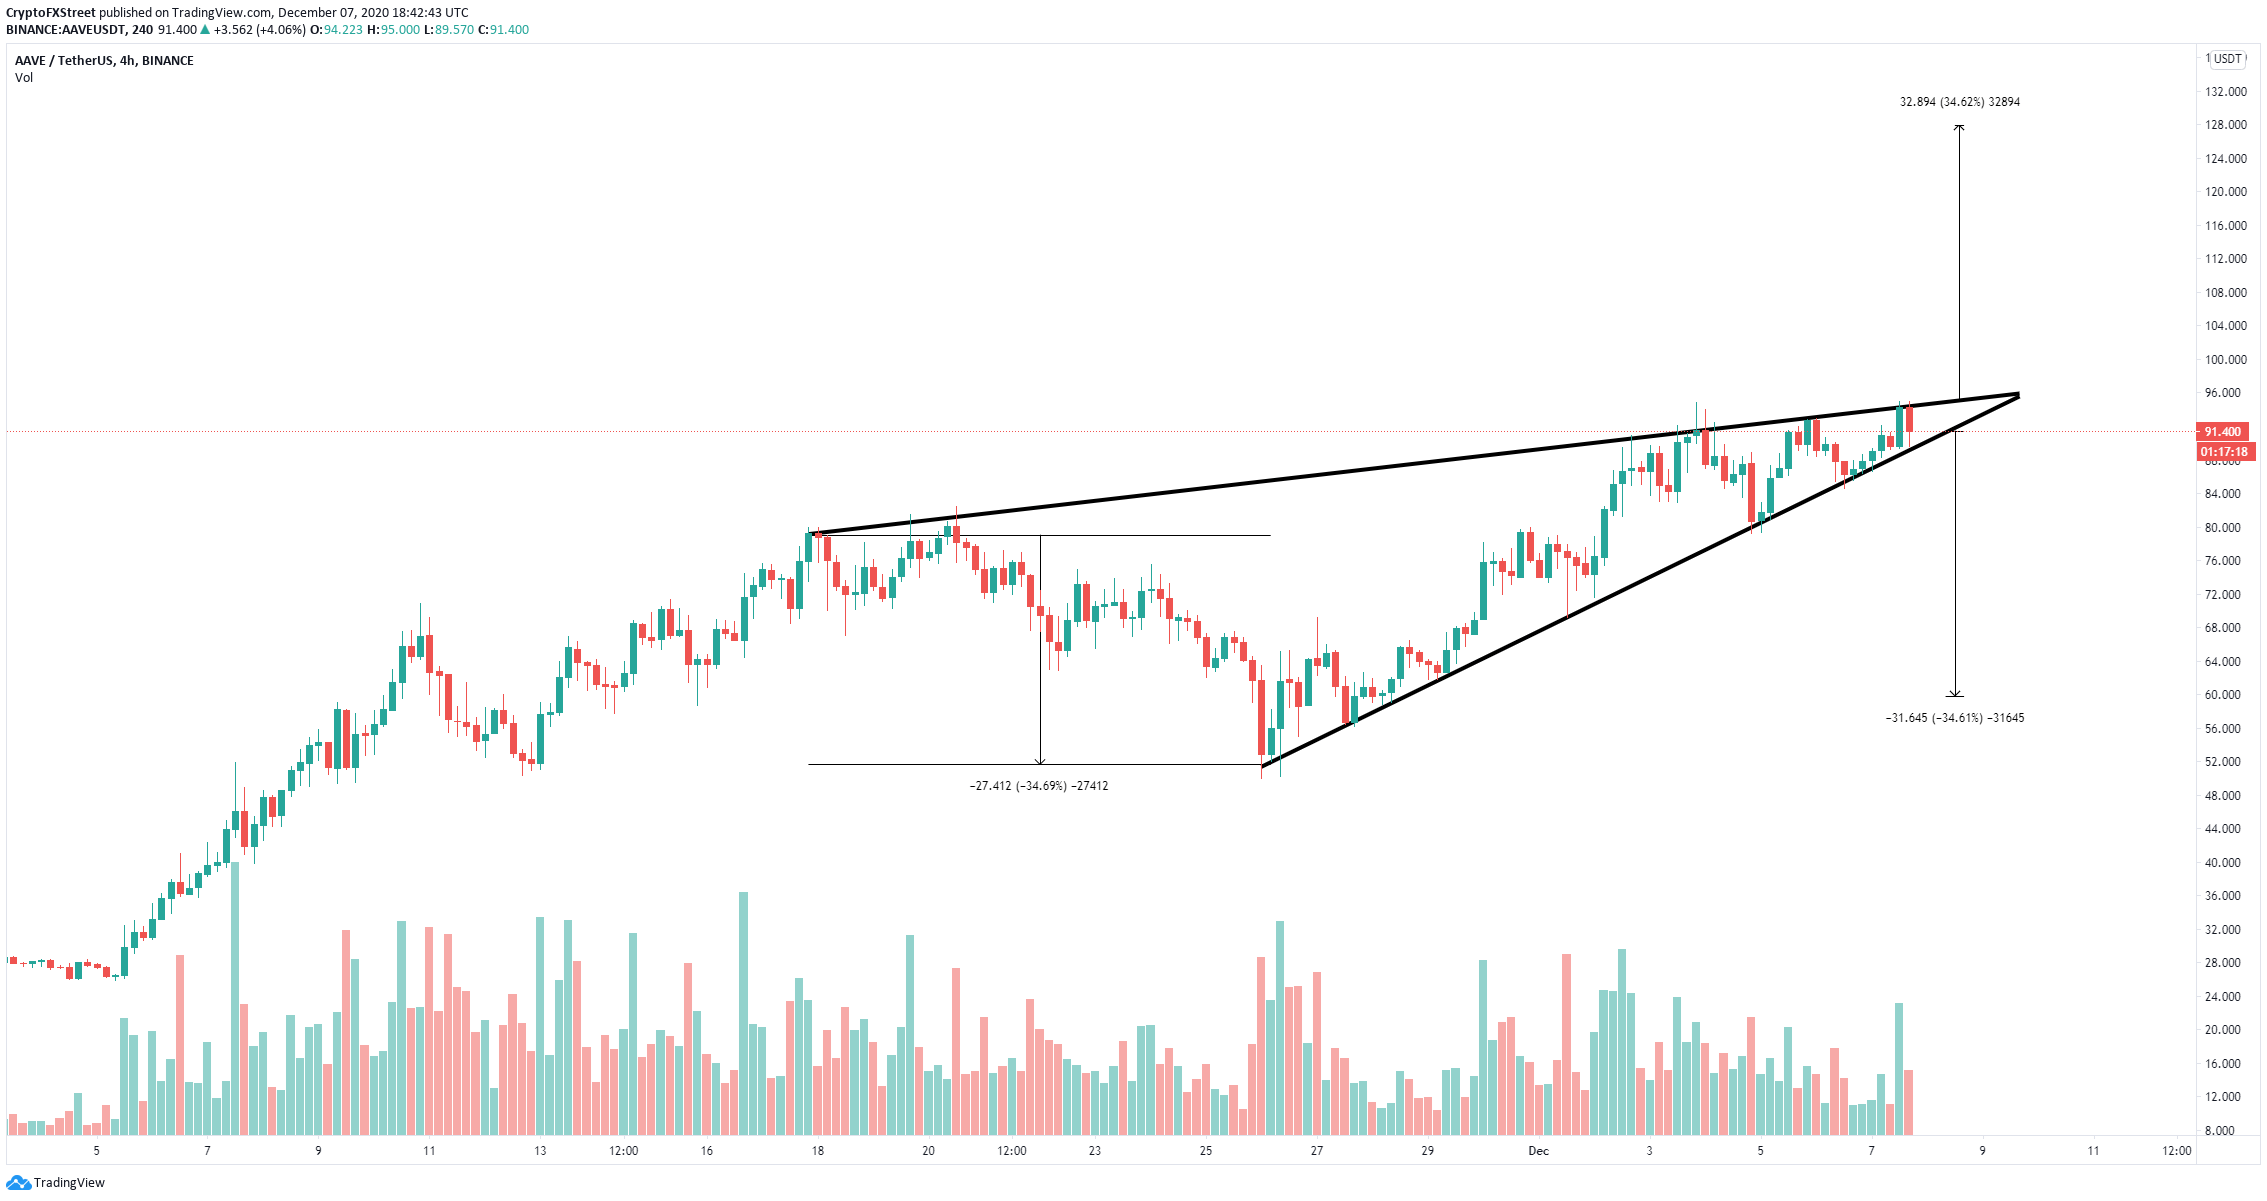
AAVE/USD 4-hour chart
Unfortunately, it seems that the TD Sequential indicator has presented a sell signal on the daily chart for the first time since the swap. A breakdown below the lower trendline of the ascending wedge at $90 would quickly drive Aave price towards $60.
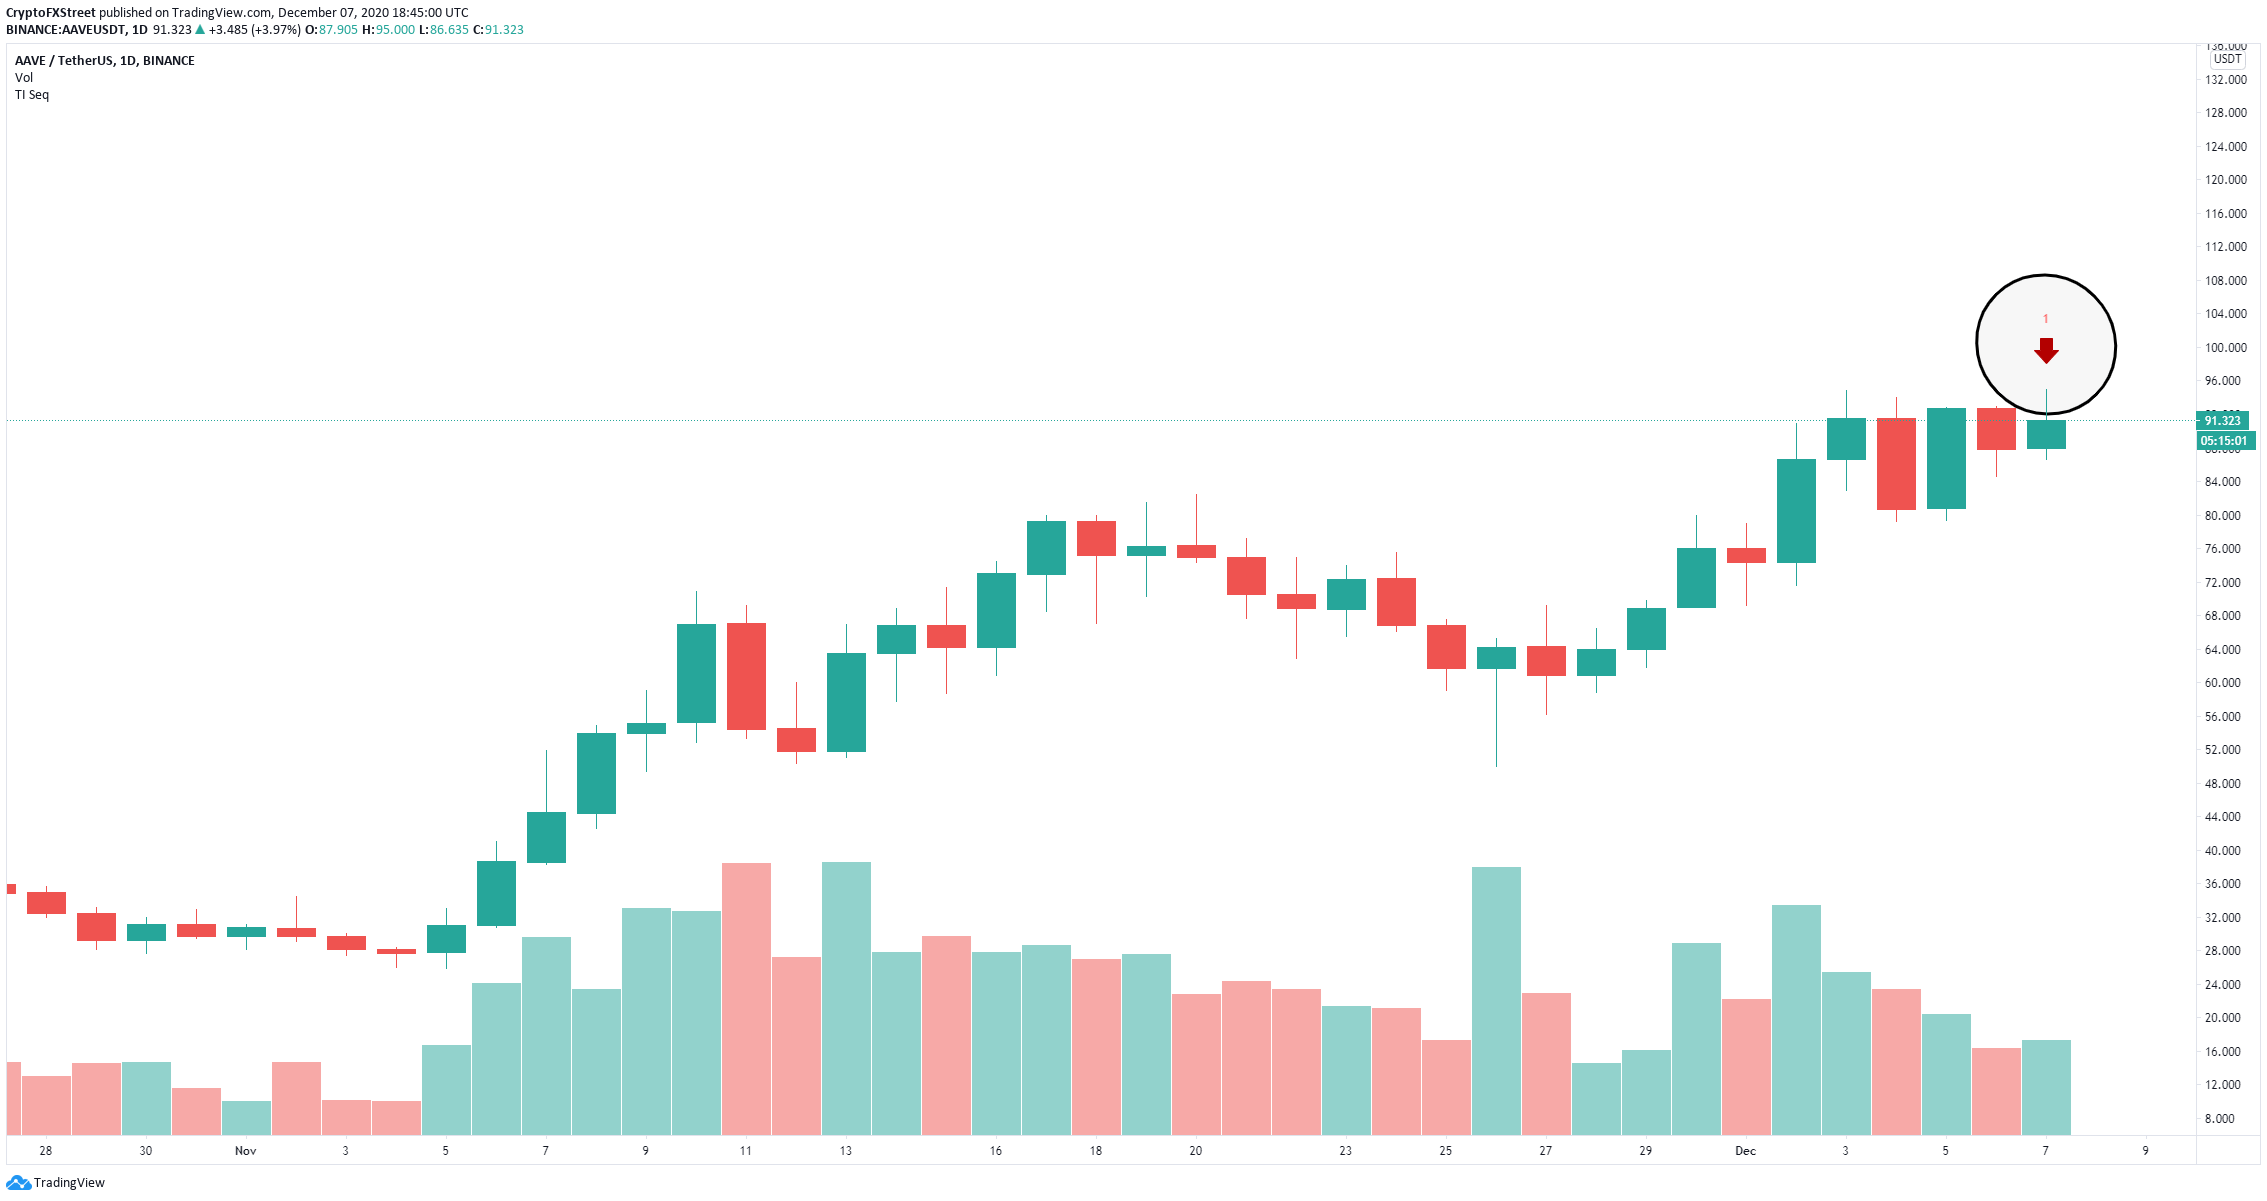
AAVE/USD daily chart
On the other hand, a breakout above the upper boundary of the pattern can push Aave price towards and above $100 and potentially to a high of $130 as a long-term price target for the bulls.
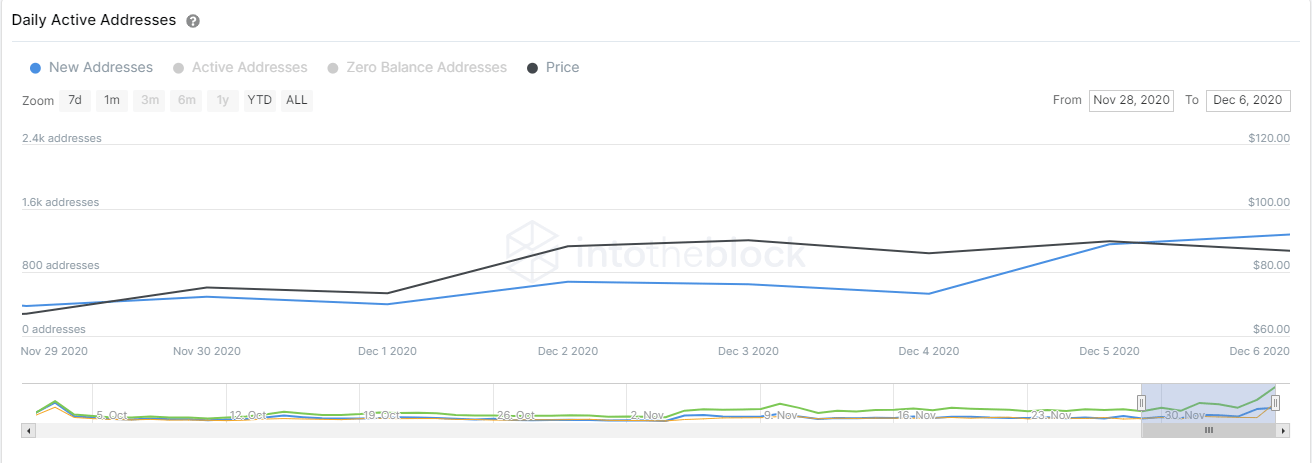
AAVE new addresses chart
The chart of new addresses joining the network shows a massive influx in this number in the past week, jumping by 237%. This metric shows that new investors are extremely interested in the digital asset which translates into buying pressure.
