- Algorand price faell below the 50-day simple moving average (SMA) for the first time since December 23, 2020.
- The Relative Strength Index (RSI) shows a balance between buyers and sellers.
- Investors must watch for support around the psychological level of $1.00.
Algorand price defined an ascending channel for 25 days, just above the 50-day SMA. On Monday, ALGO closed decisively below the lower trendline and the medium-term moving average. It could be a sign of impatience among traders or an alert that a deeper correction is about to unfold.
Algorand price breakdown could be short-lived
A spike in selling did not drive the ALGO decline below the ascending channel and the 50-day SMA. In fact, volume on Monday was 50% below the daily average of 60.88M.
A continuation of the ALGO breakdown will find immediate and substantive support at the convergence of $1.00 with the 0.50 retracement level at $0.98, representing a loss of 14% from the current price level.
Another significant Algorand price level comes in at the August 2019 high and the February 23 low at $0.85. A final but equally important support is at the confluence of the August 2020 high with the 0.618 Fibonacci retracement level at $0.77.
Each of the levels mentioned above present good risk levels for nimble traders, but beware that a price vacuum exists below $0.77.
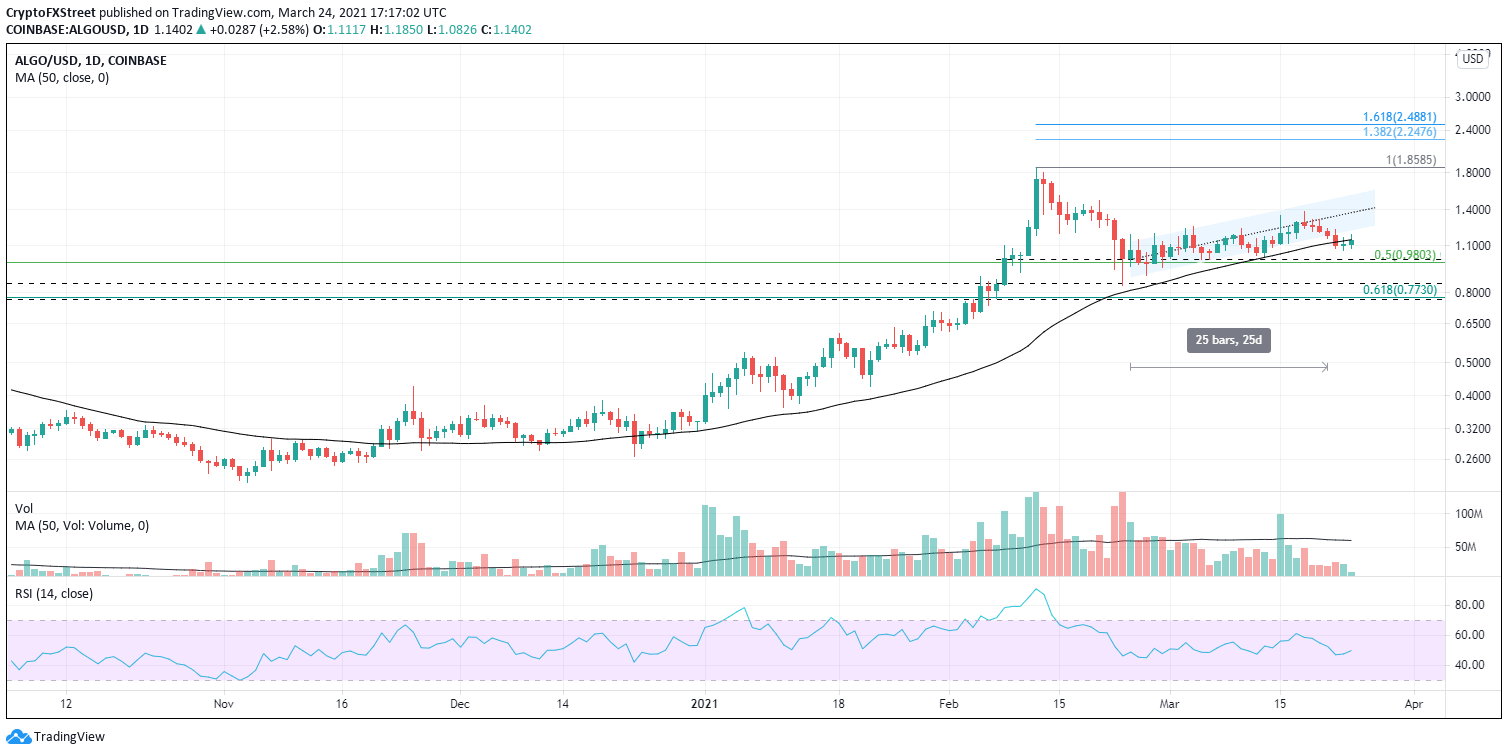
ALGO/USD daily chart
A daily close inside the channel will be the first signal that this week’s weakness is just a shake-out of impatient traders. The channel’s mid-line at $1.38 is a critical resistance going back to March 5, followed by the channel’s upper trendline at $1.54.
In either direction, the ALGO chart has marked support and resistance levels that should keep sharp moves contained in the short-term.
