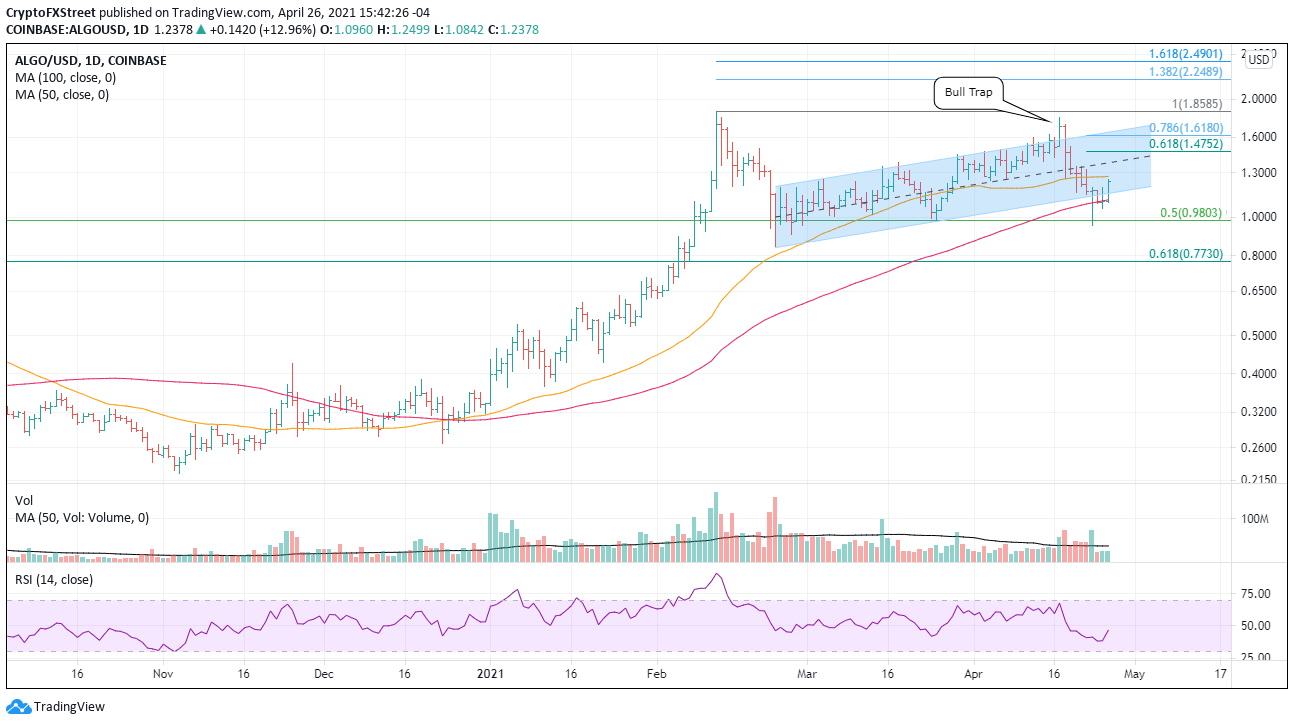
- Algorand rebounds from the 100-day simple moving average, but volume is uninspired.
- ALGO triggers the April 23 bullish hammer candlestick pattern.
- Late March low and 50% retracement level team up to halt correction.
Algorand price strength proves to be sustainable today, and it lays the groundwork for a rally to the ascending channel’s upper trend line at $1.64.
Algorand price bounces out of bed for a 20% gain
After catching speculators in a bull trap on April 17, ALGO immediately turned down and declined almost 50% before marking a bullish hammer candlestick pattern on April 23. The bottom slightly undercut the convergence of the late March low with the 50% retracement level at $0.98.
Today ALGO traded above the hammer’s high at $1.195, triggering a buy signal that has carried the digital token above the channel’s lower trend line and close to the 50-day SMA at $1.27. If the rally sticks, it clarifies the short-term outlook and opens a path to the channel’s upper trend line at $1.64.
The 50-day SMA at $1.27 is the first obstacle for Algorand price, followed by the mid-line of the channel at $1.38 and then the 61.8% Fibonacci retracement of the April decline at $1.47. A pause or mild reversal may unfold at the 78.6% retracement at $1.62, but it is anticipated that the magnet effect associated with the upper trend line will pull ALGO to $1.64.
Higher targets will need to be determined after ALGO reaches the channel’s upper trend line.
ALGO/USD daily chart
The cryptocurrency market can turn on a dime, and a new bearish turn would knock ALGO below the lower trend line and to the 100-day SMA at $1.11 again. A test of this month’s low at $0.95 would have to be considered, dependent on the impulsiveness of the decline. Further weakness will not find support until the February low at $0.84.

