- BCH/USD and LINK/USD both experience massive bullish price action.
- LINK/USD currently faces resistance at the SMA 20 curve.
BCH/USD daily chart
-637317497924419252.png)
BCH/USD jumped up from $287.85 to $294.30 this Thursday. The bulls managed to take the price above the $300-level, but have since retreated. The MACD shows increasing bullish momentum, while the price is trending above the 20-day Bollinger Band. The latter indicates that the asset is overvalued and may face bearish correction this Friday.
The price has healthy support levels at $294.30, $273.70 (SMA 200) and $266.
LINK/USD daily chart
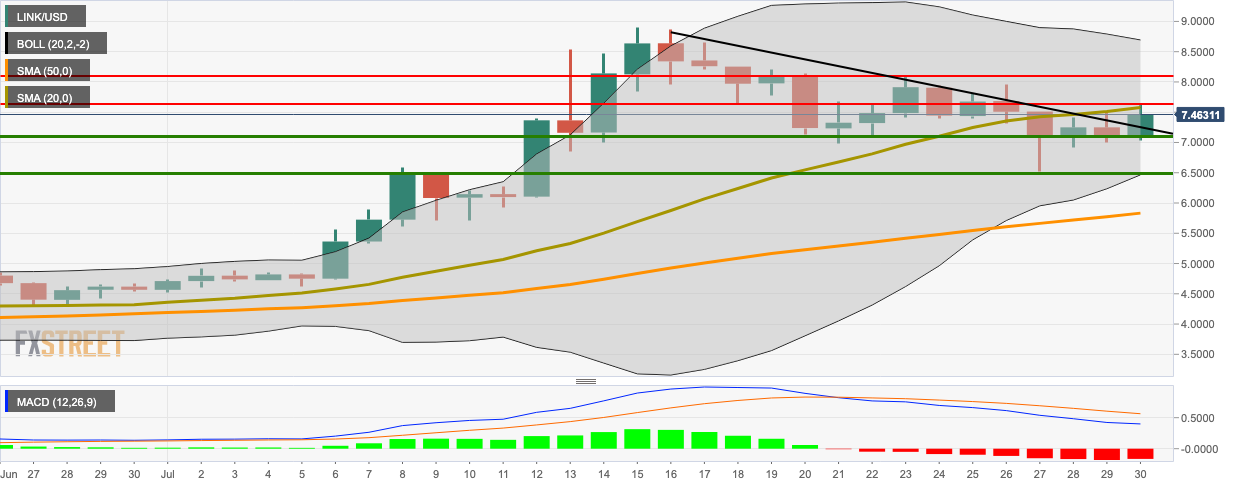
LINK/USD bulls took charge of the market this Thursday as the price jumped from $7.08 to $7.46, breaking above the downward trending line, in the process. The price has currency found resistance at the SMA 20 curve. The signal line and MACD line have stopped diverging, indicating a reversal of bearish momentum.
The price shows strong resistance at $7.60 (SMA 20), $7.65 and $8.09. On the downside, there are healthy support levels at $7.12, $6.51 and $5.85 (SMA 50).
