BCH/USD, ETC/USD and LINK/USD faced bearish Sundays. ETC/USD bears retained control this Monday. BCH/USD daily chart BCH/USD bulls took over the market, following a heavily bearish Sunday. The price has gone up from $283.80 to $293.75 as bulls look to re-enter the $300-zone. The Elliott Oscillator has had two straight red sessions. There are two strong resistance levels at $301.20 and $319.72. On the downside, healthy support exists at $282.25, $273.75 (SMA 200), $257.55 (SMA 20), $248.30 and $241.73 (SMA 50). ETC/USD daily chart 
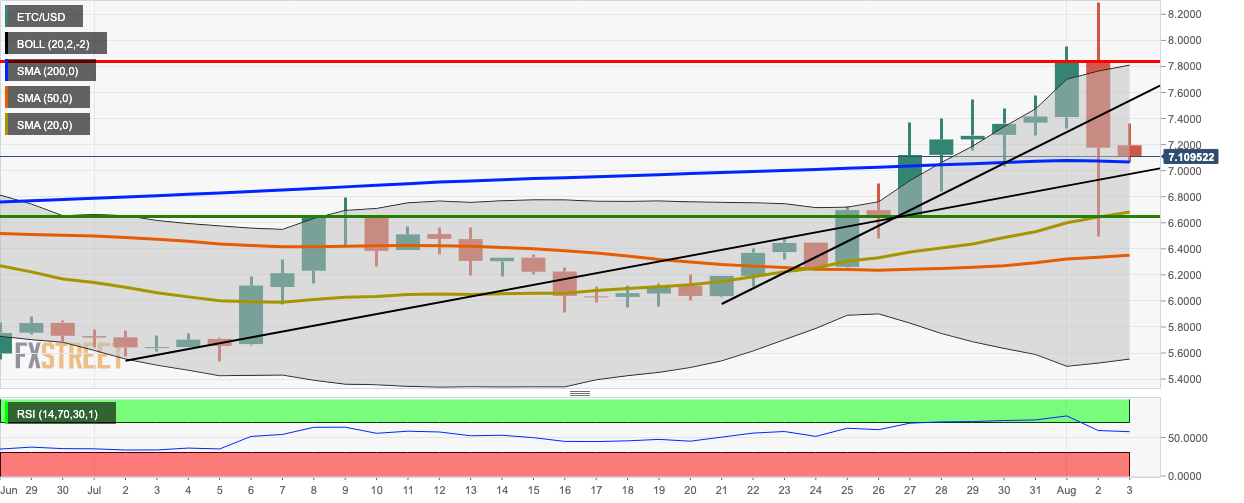
ETC/USD bears remained in control of the market for two straight days as the price looks to drop below the $7-level. This Monday, the price has fallen from $7.20 to $7.12. The RSI is trending horizontally around 58.11. To continue downward momentum, the bears must overcome healthy support levels at $7.07 (SMA 200), $6.65 (SMA 20) and $6.356. LINK/USD daily chart LINK/USD bulls regained control of the market following a slightly bearish Sunday. This Monday, the price has gone up from $8.28 to $8.71. The price reached intraday highs of $8.90 before it retreated a bit from the 20-day Bollinger Band’s upper curve. The price has found support on the upward trending line. The MACD shows that market momentum has changed from bearish to bullish. Good support lies at $8.11, $7.82 (SMA 20) and $7.60. FX Street FX Street FXStreet is the leading independent portal dedicated to the Foreign Exchange (Forex) market. It was launched in 2000 and the portal has always been proud of their unyielding commitment to provide objective and unbiased information, to enable their users to take better and more confident decisions. View All Post By FX Street Crypto News share Read Next BoJ’s Kuroda: Aiming to channel funds to companies hit by the coronavirus pandemic FX Street 3 years BCH/USD, ETC/USD and LINK/USD faced bearish Sundays. ETC/USD bears retained control this Monday. BCH/USD daily chart BCH/USD bulls took over the market, following a heavily bearish Sunday. The price has gone up from $283.80 to $293.75 as bulls look to re-enter the $300-zone. The Elliott Oscillator has had two straight red sessions. There are two strong resistance levels at $301.20 and $319.72. On the downside, healthy support exists at $282.25, $273.75 (SMA 200), $257.55 (SMA 20), $248.30 and $241.73 (SMA 50). ETC/USD daily chart ETC/USD bears remained in control of the market for two straight days as the price looks… Regulated Forex Brokers All Brokers Sponsored Brokers Broker Benefits Min Deposit Score Visit Broker 1 $100T&Cs Apply 0% Commission and No stamp DutyRegulated by US,UK & International StockCopy Successfull Traders 9.8 Visit Site FreeBets Reviews$100Your capital is at risk. 2 T&Cs Apply 9.8 Visit Site FreeBets Reviews$100Your capital is at risk. 3 Recommended Broker $100T&Cs Apply No deposit or withdrawal feesTrade major forex pairs such as EUR/USD with leverage up to 30:1 and tight spreads of 0.9 pips Low $100 minimum deposit to open a trading account 9 Visit Site FreeBets ReviewsYour capital is at risk. 4 T&Cs Apply Visit Site FreeBets ReviewsYour capital is at risk. 5 Recommended Broker $0T&Cs Apply Trade gold, silver, and platinum directly against major currenciesUp to 1:500 leverage for forex trading24/5 customer service by phone and email 9 Visit Site FreeBets ReviewsYour capital is at risk.