The Australian dollar moved on, higher and higher, enjoying the holiday week to close 2017 on a positive note. Will this continue into 2018? The new year starts with figures from both China and Australia Here are the highlights of the week and an updated technical analysis for AUD/USD.
Prices of copper went up and with nothing really happening, the Aussie was reminded of the correlation with this industrial metal. In addition, the US dollar suffered from some profit taking and lost some ground.
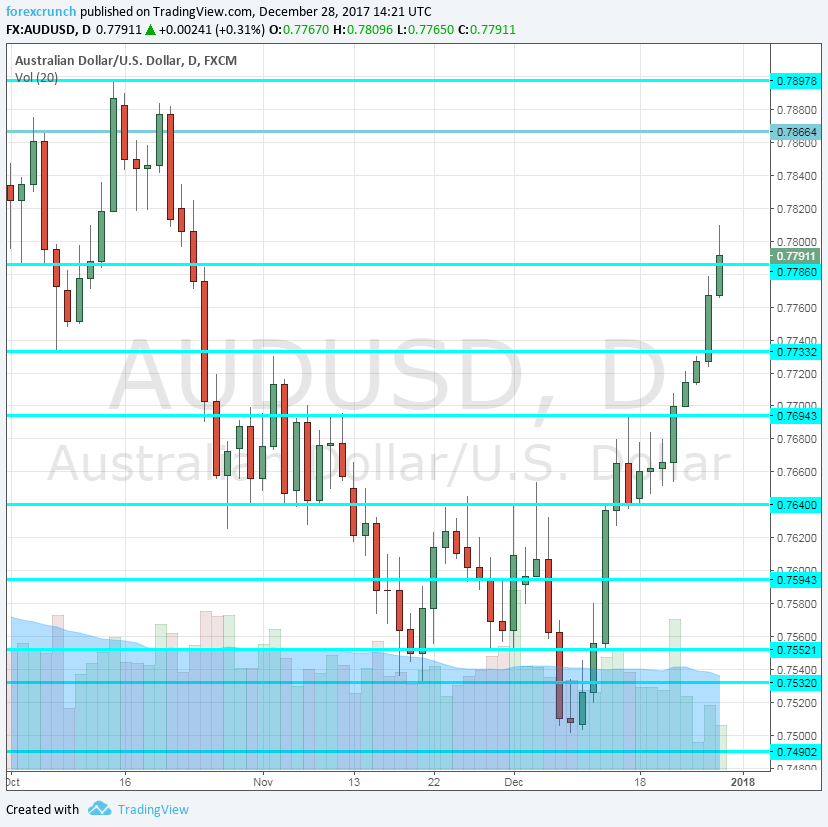
[do action=”autoupdate” tag=”AUDUSDUpdate”/]AUD/USD daily graph with support and resistance lines on it. Click to enlarge:
- AIG Manufacturing Index: Monday, 22:30. The Australian Industry Group has the privilege of publishing the first economic data point of the year. The survey of around 200 manufacturers jumped in November to 57.3 points, reflecting robust growth in the manufacturing sector. It could correct lower in December.
- Chinese Caixin Manufacturing PMI: Tuesday, 2:45. China is Australia’s No. 1 trading partner and changes in its demand for manufacturing impacts its imports of Australian metals. In November, the indicator stood at 50.8 points, very close to the 50-point threshold that separates expansion from contraction. A minor drop to 50.7 is forecast now.
- Commodity Prices: Tuesday, 5:30. As we have seen recently, the changes in commodity prices such as copper have an immediate effect on the A$. Nevertheless, this official index is eyed as well. Prices fell 3.3% in the read for November.
- AIG Services Index: Wednesday, 22:30. Contrary to the manufacturing sector, Australia’s services sector is not doing that well, with slower growth. The indicator stood at 51.7 points in November.
- Trade Balance: Friday, 00:30. Australia still enjoyed a surplus in its trade balance in October, but only just. The positive figure of 0.11 billion was the lowest since the land down under went out of a deficit into a surplus early in the year. A wider surplus of 0.55 billion is estimated.
AUD/USD Technical Analysis
Aussie/USD enjoyed a rally, initially hesitating at 0.7730 (mentioned last week) but then continuing higher and higher.
Technical lines from top to bottom:
The psychological round level of 0.80. Below, we find 0.7940, which capped the pair in August.
0.7860 served as support during September and is another line to watch. 0.7785 was a stepping stone on the way up.
Below, we find 0.7730, that was a high point in June 2017 and also beforehand, working as resistance in November. The round number of 0.77 capped the pair in mid-December. 0.7640 worked as resistance in November.
0.7595 was a swing high in early December and capped the pair. 07550 provided support in late November.
0.7530 is the cycle low, very close to the previous line and the last stop before the round number of 0.75.
I am bearish on AUD/USD
The Aussie certainly took advantage of the downfall of the greenback and the rise in copper prices. However, this significant rise is not really in line with economic fundamentals.We could see a correction now.
Our latest podcast is titled What does 2018 have in store for financial markets?
Follow us on Sticher or iTunes
Further reading:
- EUR/USD forecast – for everything related to the euro.
- GBP/USD forecast – Pound/dollar predictions
- USD/JPY forecast – projections for dollar/yen
- USD/CAD forecast – Canadian dollar analysis
- Forex weekly forecast – Outlook for the major events of the week.
Safe trading!
