- AIG Manufacturing Index: Sunday, 22:30. The index pushed back into expansion territory in September, but the reading of 51.3 points to stagnation. Will we see a stronger reading in August?
- MI Inflation Gauge: Monday, 1:00. This indicator helps analysts track inflation on a monthly basis, as the official CPI release is published every quarter.
- Company Operating Profits: Monday, 1:30. Company earnings is a key gauge of the health of the e economy. In Q1, the indicator rebounded with a gain of 1.7%, but this was shy of the forecast of 2.9%. The estimate for Q2 stands at 2.1%.
- Chinese Caixin Manufacturing PMI: Monday, 1:45. The U.S-China trade war has taken a toll on the Chinese manufacturing sector, and the PMI has dipped below the 50-level for two straight consecutive months. The index came in at 49.9 in July, and the forecast for August stands at 49.8.
- Retail Sales: Tuesday, 1:30. Retail Sales is the primary gauge of consumer spending and should be treated as a market-mover. The indicator rose 0.4% in June, edging above the estimate of 0.3%. The forecast for the July release stands at 0.2%.
- Current Account: Tuesday, 1:30. Australia has a chronic account deficit. However, in Q1, the deficit fell to A$2.9 billion, compared to 7.2 billion in the first quarter. The markets are predicting a small surplus in Q2, with an estimate of 1.5 billion.
- RBA Rate Decision: Tuesday, 4:30. The RBA is expected to hold the course at the upcoming meeting and maintain the benchmark rate at 1.00%. Investors will be glued to the rate statement, as a dovish message from rate-setters could send the Aussie downwards.
- AIG Services Index: Tuesday, 22:30. The services sector has been struggling, and the index slipped to 43.9 in July, down sharply from the June reading of 52.2. Will we see a rebound in the August release?
- GDP: Wednesday 1:30. The economy gained 0.4% in Q1, up from 0.2% in the fourth quarter of 2018. The upward trend is expected to continue in Q3, with an estimate of 0.5%.
- Trade Balance: Thursday, 1:30. Australia’s trade surplus improved to A$8.04 billion in June, above the estimate of 6.05 billion. Investors are expecting a smaller surplus in July, with a forecast of 7.20 billion.
- AIG Construction Index: Thursday, 22:30. The construction sector continues to decline. In July, the index fell to 39.1, the first time it has slipped below the 40-level since June 2013.
*All times are GMT
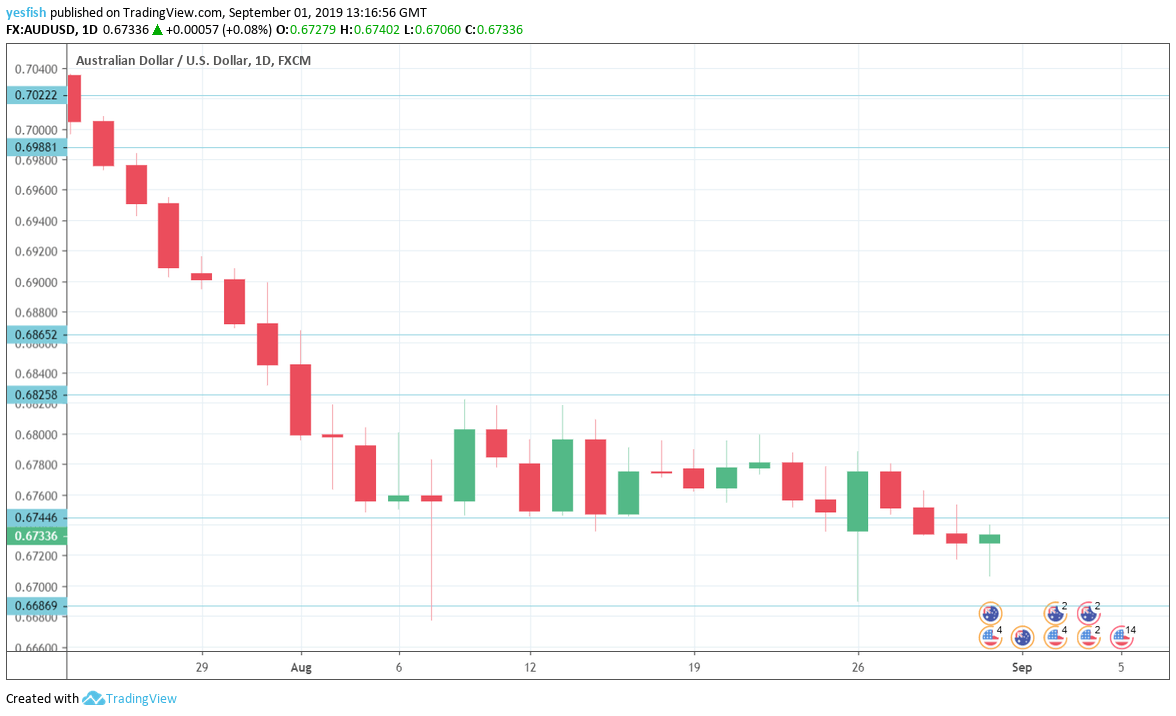
Technical lines from top to bottom:
We start with resistance at 0.7165. This line has held since early April.
0.7085 was a low point in September. 0.7022 is next.
0.6988 marked the low point in April.
0.6865 is next.
0.6825 (mentioned last week) is the next resistance line.
0.6744 was relevant throughout the week. It is currently a weak resistance line.
0.6686 was a cap back in January 2000.
0.6627 has held in support since March 2009. 0.6532 is next.
0.6456 follows.
0.6341 has held in support since 2003.
I remain bearish on AUD/USD
Economic conditions in Australia are weak, and it remains to be seen if the rate cuts earlier this year will stimulate the economy. With the U.S. showing signs of weaker growth in Q2, investor risk appetite has weakened, so risk currencies like the Aussie remain vulnerable.
Follow us on Sticher or iTunes
Further reading:
- EUR/USD forecast – for everything related to the euro.
- GBP/USD forecast – Pound/dollar predictions
- USD/JPY forecast – projections for dollar/yen
- USD/CAD forecast – Canadian dollar analysis
- Forex weekly forecast – Outlook for the major events of the week.
Safe trading!
