AUD/USD had an uneventful week, and showed almost no change. The pair closed the week just shy of the 0.73 line. This week’s highlights are Retail Sales and Employment Change. Here is an outlook on the major market-movers and an updated technical analysis for AUD/USD.
In the US, the Federal Reserve remained cautious in its policy statement but did acknowledge improvement in the US economy. Advance GDP rebounded with a gain of 2.6% in Q2, but this fell short of the estimate. Australian PPI was within expectations but Building Approvals plunged.
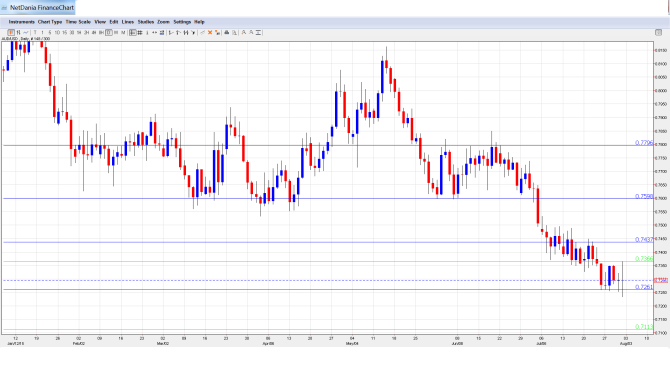
[do action=”autoupdate” tag=”AUDUSDUpdate”/]AUD/USD graph with support and resistance lines on it. Click to enlarge:
- MI Inflation Gauge: Monday, 00:30. This monthly indicator helps analysts track CPI releases, which are only released each quarter. The index slipped to 0.1%, marking a four-month low.
- HIA New Home Sales: Monday, 1:00. The indicator provides a snapshot of the level of activity in the housing market. In May, the indicator posted a decline of 2.3%, compared to a gain of 0.6% a month earlier.
- ANZ Job Advertisements: Monday, 1:30. This employment indicator rebounded in June with a strong gain of 1.3%. Will we see another strong reading in the July report?
- Chinese Caixin Final Manufacturing PMI: Monday, 1:45. Chinese key events can have a substantial impact on the movement of AUD/USD, as the Asian giant is Australia’s number one trading partner. The index came in at 49.4 points in June, within expectations. The July report stands at 48.3 points.
- Retail Sales: Tuesday, 1:30. Retail Sales is the primary gauge of consumer spending, a key driver of economic growth. The indicator improved in May, posting a gain of 0.3%. The markets are expecting the upward trend to continue, with an estimate of 0.5%.
- Trade Balance: Tuesday, 1:30. The trade deficit narrowed to A$2.75 billion in May, but this was worse than the forecast of A$2.21 billion. The markets are expecting a larger deficit in June, with a forecast of A$-3.06 billion.
- Cash Rate: Tuesday, 4:30. The RBA’s benchmark rate has been pegged at 2.00% for the past three months, and no change is expected in the August rate announcement.
- Commodity Prices: Tuesday, 6:30. Commodity Prices continues to struggle, and this weighs on the Aussie since commodities make up a significant portion of the country’s export sector. The June reading posted a decline of 17.9%, as small improvement from a month earlier.
- AIG Services Index: Tuesday, 23:30. The index improved in June with a reading of 51.2 points, which indicates slight expansion. This was the index’s best showing in three months.
- Employment Change: Thursday, 1:30. Employment Change is one of the most important economic indicators, and an unexpected reading can have a strong impact on the movement of AUD/USD. The indicator came in at +7.3 thousand in June, crushing the estimate of -2.1 thousand. The markets are expecting another gain in the July report, with an estimate of +12.5 thousand. The unemployment rate is expected to rise to 6.1%, up from the current level of 6.0%.
- AIG Construction Index: Thursday, 23:30. The indicator has only posted one reading above 50 in 2015, indicative of ongoing contraction in the construction sector.
- RBA Monetary Policy Statement: Friday, 1:30. The RBA will release a policy statement of its most recent policy meeting. As the RBA held rates at the low levels of 2.00%, no dramatic news is expected from the policy statement.
- Home Loans: Friday, 1:30. Home Loans provides a snapshot of the levels of activity in the housing sector. The indicator looked awful in May, slipping by 6.1%. This was much weaker than the estimate of a 3.3% drop. The markets are expecting a strong turnaround in the June report, with an estimate of a 5.2% gain.
- Chinese Trade Balance: Saturday, Tentative. The trade surplus dipped to $46.5 billion in June, well off the estimate of $57.0 billion. However, better news could be around the corner, as the markets are expecting the surplus to increase to $53.4 billion in July.
* All times are GMT.
AUD/USD Technical Analysis
AUD/USD opened the week at 0.7274. Late in the week, the pair dropped to a low of 0.7233, testing support at 0.7266 (discussed last week), before rebounding and climbing to a high of 0.7366. AUD/USD closed the week at 0.7295.
Live chart of AUD/USD: [do action=”tradingviews” pair=”AUDUSD” interval=”60″/]
Technical lines from top to bottom:
We start with resistance at 0.7798. This line was an important resistance level for much of June.
0.7692 remains a strong resistance line.
0.7597 was an important support level in June.
0.7438 marked the start of the current greenback rally, which has seen the pair dip below the 0.73 line.
0.7266 was tested for a second straight week and is an immediate support line.
0.7113 has held firm since April 2009.
0.7011 was a key support level in March 2006. It is protecting the symbolic line of 0.70.
0.6931 is the next support line.
0.6843 is the final support level for now.
I am bullish on USD/AUD
With the US economy showing some strong numbers for Q2, speculation remains high that rates will rise, perhaps as early as September. Monetary divergence with the RBA will likely continue to weigh on the Aussie.
In our latest podcast, we drill down the deals, the aGreekment and Iran and the market impact.
Further reading:
- For a broad view of all the week’s major events worldwide, read the USD outlook.
- For EUR/USD, check out the Euro to Dollar forecast.
- For the Japanese yen, read the USD/JPY forecast.
- For GBP/USD (cable), look into the British Pound forecast.
- For the Canadian dollar (loonie), check out the Canadian dollar forecast.
- For the kiwi, see the NZDUSD forecast.
