AUD/USD rebounded sharply last week, climbing close to 200 points. The pair closed at 0.7363, its highest weekly close since late April. This week’s highlight is the RBA Cash Rate. Here is an outlook on the major market-movers and an updated technical analysis for AUD/USD.
In Australia, Building Approvals and GDP impressed with strong gains. Over in the US, Non-Farm Payrolls shocked the markets with a disastrous gain of only 38K jobs. The US dollar took a beating on Friday as AUD/USD posted strong gains.
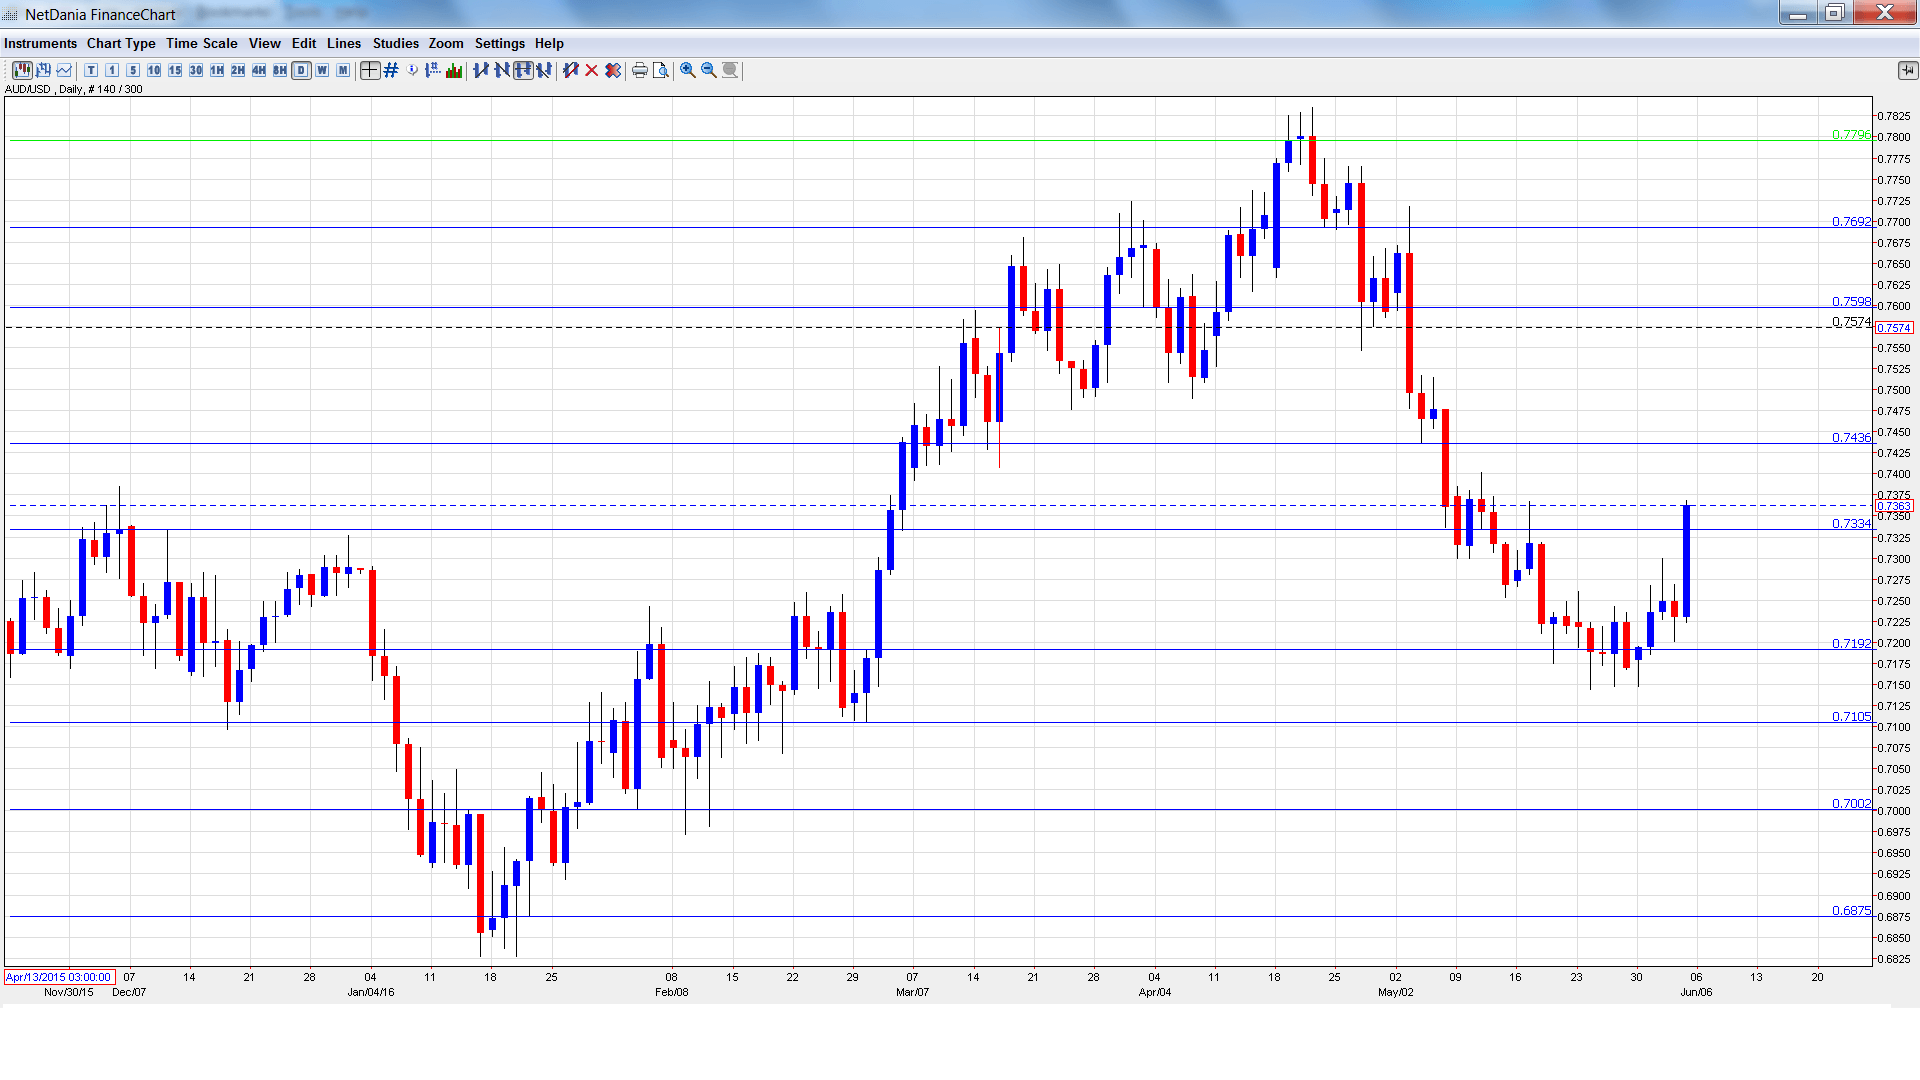
[do action=”autoupdate” tag=”AUDUSDUpdate”/]AUD/USD graph with support and resistance lines on it. Click to enlarge:
- MIA Inflation Gauge: Monday, 1:00. This monthly indicator helps analysts track CPI, which is released on a quarterly basis. Inflation remains low, as the indicator edged up to 1.0% in April.
- ANZ Job Advertisements: Monday, 1:30. This indicator provides a snapshot of the strength of the labor market. The indicator has been alternating between gains and declines, and posted a drop of 0.8% in April. Will we see a rebound in the May release?
- AIG Construction Index: Tuesday, 23:30. After pointing to contraction for four straight months, in April the index pushed above the 50-level, which separates contraction from expansion. The April report came in at 50.8 points, which points to stagnation in the construction sector.
- Cash Rate: Tuesday, 4:30. In May, the RBA surprised the markets and cut rates a quarter point, from 2.00% to 1.75%. Although the RBA has been sending clear messages that another rate cut is in the offing, no change is expected in the May rate announcement.
- Home Loans: Wednesday, 1:30. Home Loans declined in March by 0.9%, but this was better than the forecast of -1.4%. The markets are expecting a strong turnaround in the April report, with an estimate of 2.6%.
- Chinese Trade Balance: Wednesday, Tentative. Chinese key indicators can have a strong impact on the movement of AUD/USD, as China is Australia’s largest trading partner. Trade Balance jumped to $US 298 billion in April, beating the estimate of $250 billion. The upward trend is expected to continue, with an estimate of $358 billion.
* All times are GMT
AUD/USD Technical Analysis
AUD/USD opened the week at 0.7178 and quickly touched a low of 0.7148. AUD/USD then changed directions and climbed to a high of 0.7368, breaking past resistance at 0.7334 (discussed last week). AUD/USD closed the week at 0.7363.
Live chart of AUD/USD: [do action=”tradingviews” pair=”AUDUSD” interval=”60″/]
Technical lines from top to bottom:
With the Australian dollar posting gains, we start at higher levels:
0.7798 was an important resistance line for much of June 2015.
0.7692 is protecting the 0.77 line.
0.7597 is the next line of resistance.
0.7438 has held firm since early May.
0.7334 was a cap in December 2015.
0.7192 has switched to a support role following sharp gains by AUD/USD.
0.7105 has been a cushion since the end of February.
0.7002 is providing support just above the psychologically important level of 0.7000.
0.6875 is the final support line.
I am bearish on AUD/USD
The dismal jobs report in the US shocked the markets. This weak release could lead the Fed to remain on the sidelines in June, but a July move remains on the table. With monetary divergence favoring the US dollar, we could see a rebound from the greenback this week.
Our latest podcast is titled Payroll Problem and Rate Readiness
Follow us on Sticher or on iTunes
Further reading:
- For a broad view of all the week’s major events worldwide, read the USD outlook.
- For EUR/USD, check out the Euro to Dollar forecast.
- For the Japanese yen, read the USD/JPY forecast.
- For GBP/USD (cable), look into the British Pound forecast.
- For the Canadian dollar (loonie), check out the Canadian dollar forecast.
- For the kiwi, see the NZD/USD forecast.
