The Australian dollar showed some strength during the week, but retracted and closed the week with slight losses. AUD/USD closed the week at 0.7736. The upcoming week has nine events. Here is an outlook on the major market-movers and an updated technical analysis for AUD/USD.
It was a quiet week for Australian data, with just one minor release. In the US, inflation beat expectations and New Home Sales were also stronger than expected. However, durable goods orders and GDP missed their estimates.
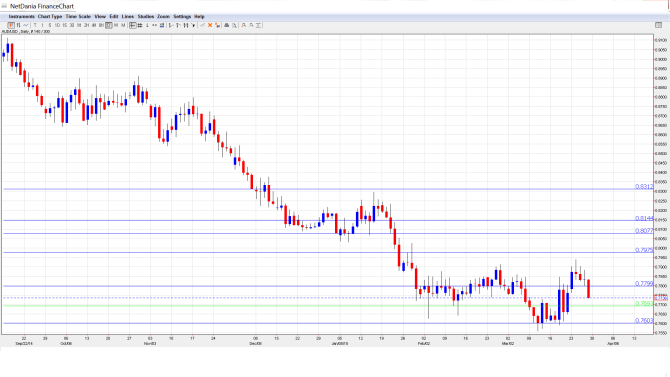
[do action=”autoupdate” tag=”AUD/USDUpdate”/]AUD/USD graph with support and resistance lines on it. Click to enlarge:
- HIA New Home Sales: Tuesday, 1:00. This indicator gives a snapshot of the strength of the Australian housing market. The indicator bounced back in February, with a gain of 1.8%.
- Private Sector Credit: Tuesday, 1:30. Increased credit levels usually translate into increased spending by individuals and businesses, which is key for economic growth. The indicator has been steady, and posted a gain of 0.6% in January, within expectations. The forecast for the February report stands at 0.5%.
- AIG Manufacturing Index: Tuesday, 23:30. The index remains under the 50-point level, which separates contraction from expansion. The February reading slipped to 45.4 points, as the manufacturing sector continues to struggle.
- Building Approvals: Wednesday, 1:30. This is the first key indicator of the week. Building Approvals tends to fluctuate sharply, resulting in readings that are often well off the estimate. In the January release, the indicator jumped 7.9%, crushing the estimate of -1.8%. The markets are bracing for sharp downturn in February, with an estimate of -3.7%.
- Chinese Manufacturing PMI: Wednesday, 2:00. The Australian dollar is sensitive to key Chinese data, as China is Australia’s most important trading partner. The PMI has slipped below the 50-point line, which separates contraction from expansion. The January reading came in at 49.9 points, very close to the estimate. Little change is expected in the upcoming release.
- Chinese HSBC Manufacturing PMI: Wednesday, 2:45. This indicator pushed above the 50 point level in February, the first time it has done so in three months. The PMI improved to 50.7 points, slightly above the forecast of 50.1 points. The markets are braced for a reading under the 50-point level in March, with a forecast of 49.3 points.
- Commodity Prices: Wednesday, 6:30. Commodity Prices continue to posts sharp declines. The February report showed little change, coming in at -20.6%. No significant change is expected in the upcoming release.
- MI Inflation Gauge: Wednesday, 00:30. This monthly indicator helps gauge CPI, which is released on a quarterly basis. The indicator has been showing little movement in recent readings, and came in at a flat 0.0% in February.
- Trade Balance: Thursday, 1:30. Trade Balance is closely linked to currency demand, as the foreigners must purchase Australian dollars to buy Australian goods and services. The trade deficit ballooned to A$9.8 billion in February, higher than the forecast of a A$9.4 billion deficit. The deficit is expected to worsen in March, with an estimate of A$-1.25 billion.
* All times are GMT.
AUD/USD Technical Analysis
AUD/USD started the week at 0.7782 and climbed to a high of 0.7938. The pair then reversed directions and dropped to a low of 0.7738. AUD/USD closed the week at 0.7736, below resistance at 0.7799 (discussed last week).
Live chart of AUD/USD: [do action=”tradingviews” pair=”AUDUSD” interval=”60″/]
Technical lines from top to bottom:
We start with resistance at 0.8313. This line has held firm since mid-December.
0.8150 is the next resistance line.
0.8077 was an important resistance line in January.
0.7978 was an important cap in January 2007. This line held firm as the pair flexed some muscle during the week.
0.7799 was tested for a second straight week and starts the week as an immediate resistance line.
0.7692 was an important support level in early 2007. At that time, AUD/USD recorded a rally that saw the pair push above the 0.88 level.
0.7601 is the next support level.
0.7403 has held firm since May 2009. At that time, the Aussie was in the midst of a rally which saw it climb above the 0.94 line.
The final support line for now is 0.7283.
I am bearish on AUD/USD.
The Aussie has struggled in 2015, and could be in for more trouble. US data is expected to improve, and monetary divergence will continue to weigh on the Australian currency.
In our latest podcast we interview David Stein on investment, QE and lots more
Subscribe to Market Movers on iTunes
Further reading:
- For a broad view of all the week’s major events worldwide, read the USD outlook.
- For EUR/USD, check out the Euro to Dollar forecast.
- For GBP/USD (cable), look into the British Pound forecast.
- For the Japanese yen, read the USD/JPY forecast.
- For USD/CAD (loonie), check out the Canadian dollar forecast.
- For the kiwi, see the NZDUSD forecast.
