In the US, unemployment claims surprised by missing expectations for the first time in 10 weeks. Construction data was mixed while manufacturing numbers were stronger than expected. In Australia, the economy shed 9.8 thousand jobs, much worse than expected.
AUD/USD was unchanged last week, as the pair closed at the 0.76 line. This week’s key highlight is CPI. Here is an outlook on the major market-movers and an updated technical analysis for AUD/USD.
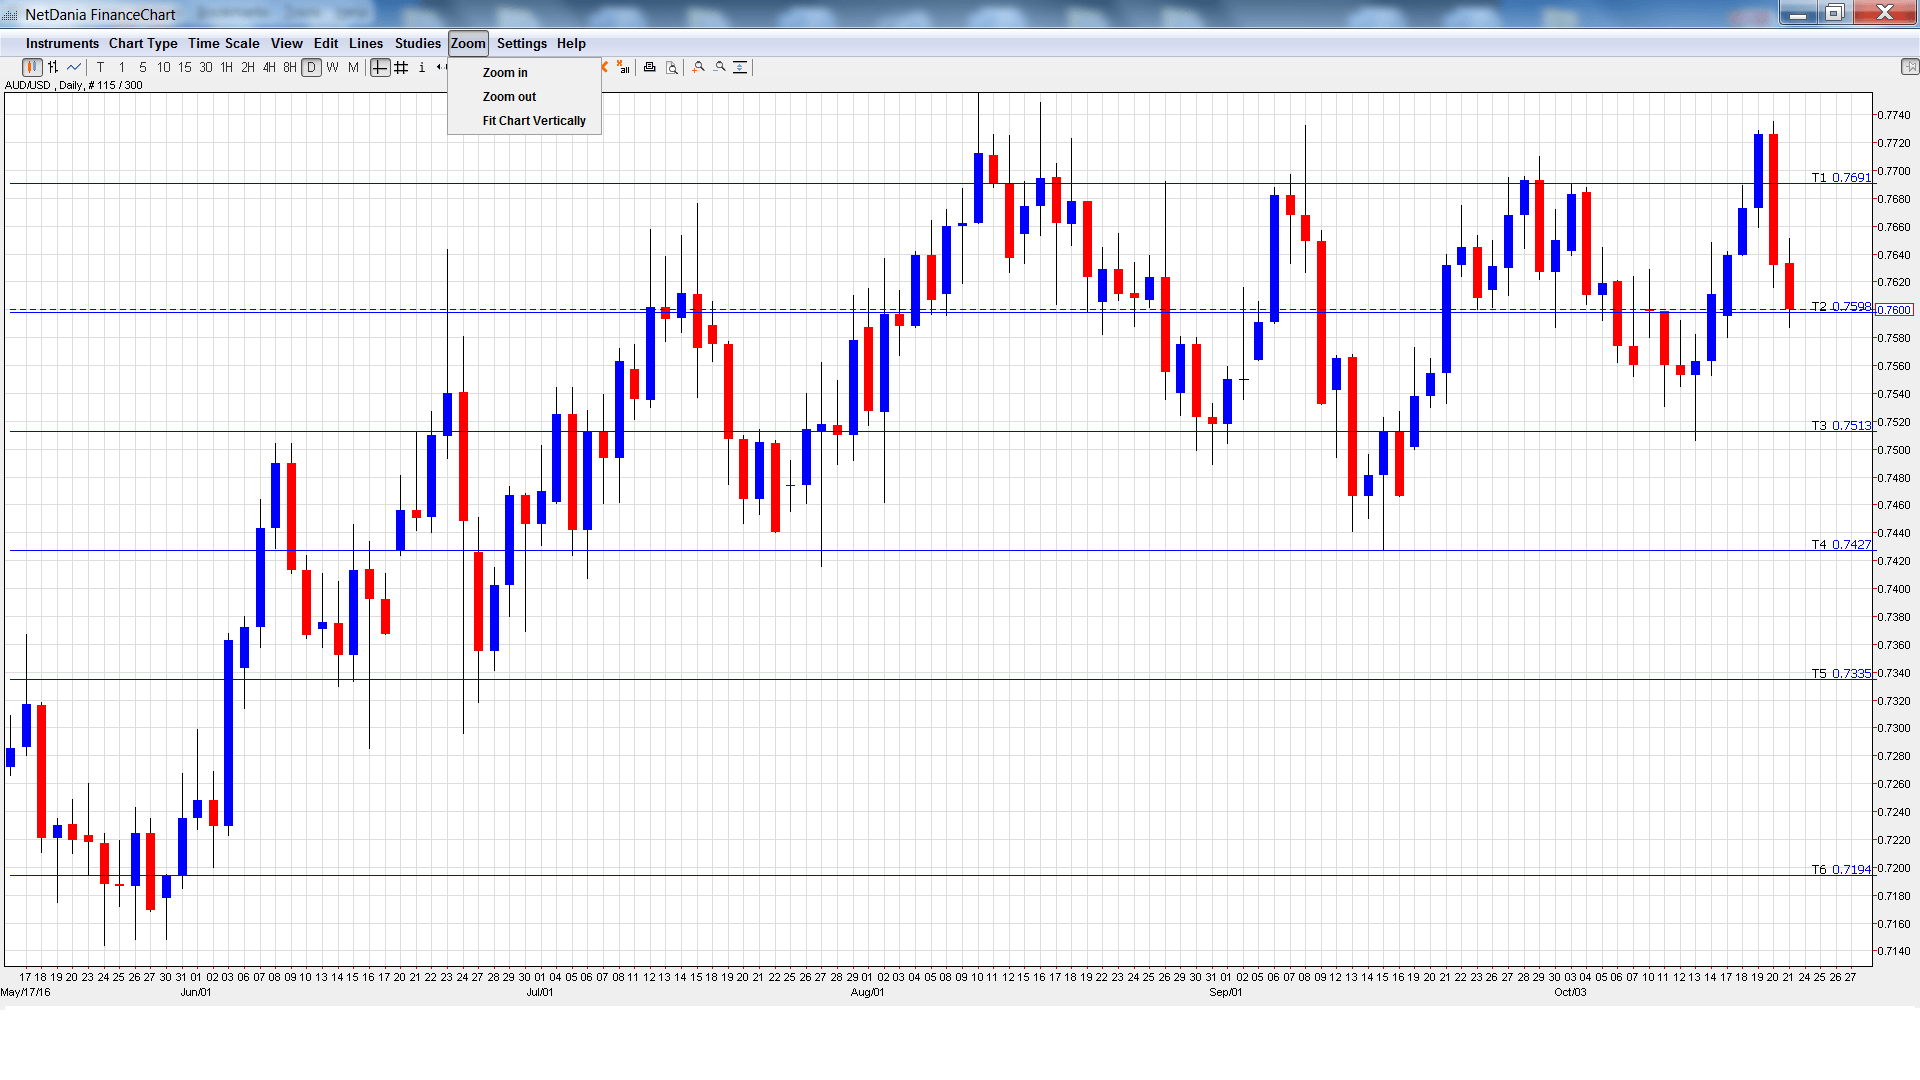
AUD/USD graph with support and resistance lines on it. Click to enlarge:
- CPI: Wednesday, 00:30. CPI is the primary gauge of consumer spending and an unexpected reading can have a sharp impact on the movement of AUD/USD. The indicator bounced back in Q2, posting a gain of 0.4%. This matched the forecast. The forecast for Q3 stands at 0.5%.
- Trimmed Mean CPI: Wednesday, 00:30. This indicator excludes the most volatile items which make up CPI. In the second quarter, the index improved to 0.5%, edging above the forecast of 0.4%. Little change is expected in the Q3 report, with an estimate of 0.4%.
- Import Prices: Thursday, 00:30. The indicator came in at -1.0% in the Q2, marking a third straight decline. This reading was well short of the forecast of +1.6%. Another decline is expected in Q3, with an estimate of -0.7%.
- HIA New Home Sales: Friday, 00:00. New Home Sales provides a snapshot of the health of the Australian housing sector. The indicator rebounded in August, posting a gain of 6.1%. Will we see another strong gain in September?
- PPI: Friday, 00:30. This important inflation report is released each quarter. In Q2, the index improved to 0.1%. The upward trend is expected to continue, with the Q3 estimate standing at 0.6%.
AUD/USD Technical Analysis
AUD/USD opened the week at 0.7595 and quickly touched a low of 0.7580. The pair climbed to a high of 0.7735, testing resistance at 0.7691 (discussed last week). AUD/USD then reversed directions late in the week and dropped sharply, closing the week at 0.7600.
Live chart of AUD/USD:
Technical lines from top to bottom:
We start with resistance at 0.8066.
0.7938 is next.
0.7835 has held firm since April.
0.7691 was a cap for much of October.
0.7597 remains busy and is currently a weak support line.
0.7513 is the next support level.
0.7427 marked the low point for the month of September.
0.7334 was a cap in December 2015.
0.7194 is the final support line for now.
I remain bearish on AUD/USD
The US economy remains strong and sentiment towards to US dollar remains positive, with a December Fed hike priced at around 70%.
Our latest podcast is titled Bold BOJ vs. Fearful Fed
Follow us on Sticher or iTunes
Further reading:
- For a broad view of all the week’s major events worldwide, read the USD outlook.
- For EUR/USD, check out the Euro to Dollar forecast.
- For the Japanese yen, read the USD/JPY forecast.
- For GBP/USD (cable), look into the British Pound forecast.
- For the Canadian dollar (loonie), check out the Canadian dollar forecast.
- For the kiwi, see the NZD/USD forecast.
