AUD/USD enjoyed another strong week, as the pair gained close to 100 points and ended the week just below the 0.72 line. There are just three events in the upcoming week. Here is an outlook on the major market-movers and an updated technical analysis for AUD/USD.
In the US, the Fed refrained from raising the rates and seemed concerned about the global economy. The Aussie took advantage with strong gains. There were no major Australian releases last week.
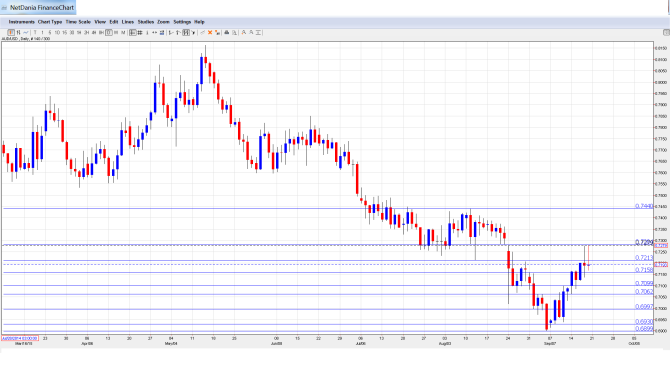
[do action=”autoupdate” tag=”AUDUSDUpdate”/]AUD/USD graph with support and resistance lines on it. Click to enlarge:
- HPI: Tuesday, 1:30. This housing price index provides a snapshot of the level of activity in the housing sector. The index is released quarterly, which magnifies the impact of each release. The Q1 dipped to 1.6%, well below the estimate of 2.2%. The markets are expecting a much stronger reading in Q2, with an estimate of 2.5%. Will the indicator match or beat this rosy prediction?
- CB Leading Index: Wednesday, 00:00. This index is based on 7 economic indicators, but is considered a minor event since most of the data has been previously released. The indicator has struggled, posting three declines in the past four readings. The June release came in at -0.2%.
- Chinese Caixin Flash Manufacturing PMI: Wednesday, 1:45. The Australian dollar is sensitive to Chinese key data such as the Caixin Flash Manufacturing PMI, as China is Australia’s largest trading partner. The indicator has been under the 50-point level for most of 2015, indicative of ongoing contraction in the manufacturing sector. The index slipped to 47.1 points in August, shy of the estimate of 48.1 points. The estimate for the September reading stands at 47.6 points.
* All times are GMT.
AUD/USD Technical Analysis
AUD/USD started the week at 0.7098 and quickly slipped to a low of 0.7062. The pair reversed directions and climbed to a high of 0.7279, testing resistance at 0.7213 (discussed last week). The pair then retracted and closed at 0.7193.
Live chart of AUD/USD: [do action=”tradingviews” pair=”AUDUSD” interval=”60″/]
Technical lines from top to bottom:
0.7440 capped the pair back in August, and remains key resistance. 0.7284 is a clear separator of ranges, also seen around the same time, and is also stronger.
The line of 0.7213 was a swing low before the recent crash, and serves as a minor line. 0.7160 capped the pair quite recently and could slow a rise.
The round 0.71 mark was challenged quite recently and is immediate resistance. It is closely followed by 0.7060 which worked in both directions of late.
The very round level of 0.70 worked as a cushion in August and remains an important battle line. 0.6930 is where the pair bounced from in September.
The last line for now is the round level of 0.69.
I remain bearish on AUD/USD
The Aussie managed to rise for a second straight week, buoyed by the Fed’s decision not to raise interest rates. Still, the Australian economic picture is not as rosy as that of the US, and if the Chinese crisis worsens, the Aussie could get hit hard.
In our latest podcast we explain why the dollar defies the doves
Further reading:
- For a broad view of all the week’s major events worldwide, read the USD outlook.
- For EUR/USD, check out the Euro to Dollar forecast.
- For the Japanese yen, read the USD/JPY forecast.
- For GBP/USD (cable), look into the British Pound forecast.
- For the Canadian dollar (loonie), check out the Canadian dollar forecast.
- For the kiwi, see the NZD/USD forecast.
