- Britain’s composite PMI increased to 54.0 in April from 52.8 in March.
- The BoE’s chief economist, Huw Pill, said that rate cuts remain some way off.
- US business activity cooled significantly, leading to a decline in the dollar.
The pound’s rise following the release of encouraging PMI data on Tuesday sparked a bullish outlook for the GBP/USD price analysis. Adding to the momentum, investors have dialed down their expectations of a Bank of England rate cut, spurred by hawkish comments. Meanwhile, the dollar was weak after PMI data revealed a decline in business activity in the US.
–Are you interested in learning more about STP brokers? Check our detailed guide-
Britain’s composite PMI increased to 54.0 in April from 52.8 in March, indicating a recovery in the economy. The rebound from its shallow recession is much faster than economists expected. Moreover, this might drive up inflation and wages, leading to a more cautious outlook for the Bank of England’s policy outlook.
Currently, markets expect the first rate cut in June or August. Notably, the BoE’s chief economist Huw Pill said that rate cuts remained some way off, emphasizing caution despite the recent decline in inflation. As a result, there was a drop in rate-cut bets.
Meanwhile, in the US, the composite PMI fell to 50.9 in April from 52.1 in March, indicating a slowdown in the economy. Such downbeat data comes as a relief to Fed policymakers as it reflects a drop in demand. However, investors will wait for Friday’s core PCE inflation report to shape the Fed’s rate-cut outlook. Markets currently predict a 73% likelihood that the central bank will cut in September.
GBP/USD key events today
Investors are not looking forward to high-impact US or UK reports today. Therefore, they will keep digesting the PMI data.
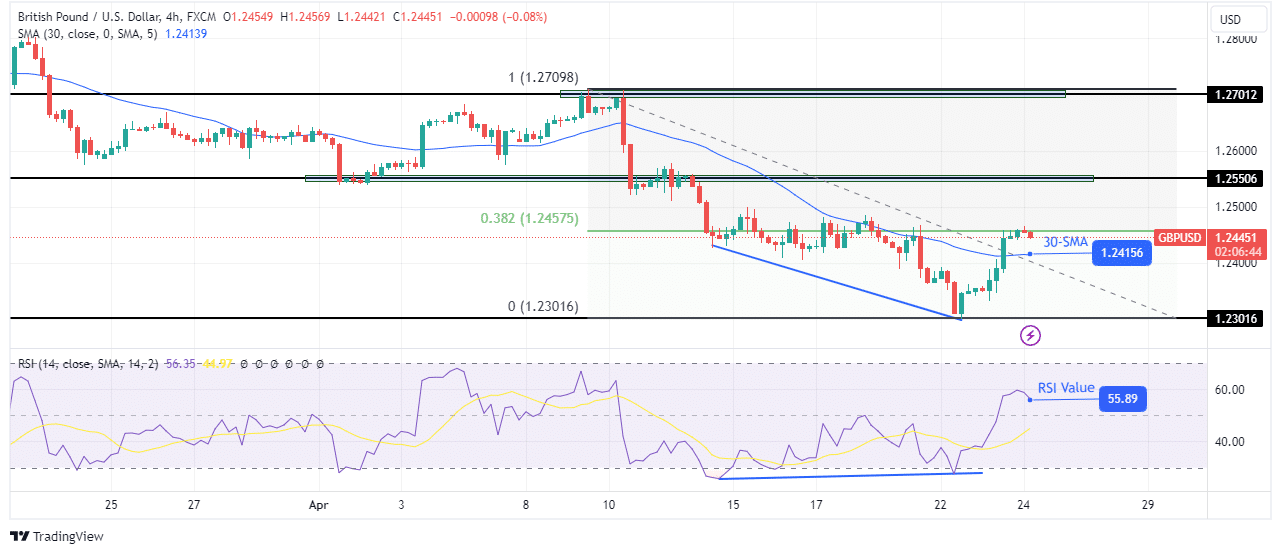
GBP/USD technical price analysis: Bullish momentum pauses at the 0.382 Fib level

On the technical side, the GBP/USD price has broken above the 30-SMA, indicating a bullish sentiment shift. Similarly, the RSI has broken above 50 and now favors bullish momentum. This shift came after the price paused at the 1.2301 key level. At that point, the RSI made a bullish divergence that showed weakness in the downtrend. As a result, bears gave up control when the price broke above the SMA.
-Are you looking for automated trading? Check our detailed guide-
However, bulls are now facing the 0.382 Fib retracement level. This might trigger a pullback to retest the SMA as support before the price targets the 1.2550 key resistance level.
Looking to trade forex now? Invest at eToro!
68% of retail investor accounts lose money when trading CFDs with this provider. You should consider whether you can afford to take the high risk of losing your money
