The Australian dollar lost a bit of ground in a mixed week. The upcoming week’s events lean towards Chinese data. Here are the highlights of the week and an updated technical analysis for AUD/USD.
RBA Governor Phillip Lowe seems to be in no rush to raise rates, and that keeps the Aussie somewhat depressed. Nevertheless, the economy continues showing positive signs, with the HPI rising 1.9%. In the US, the Fed is still on course to raise rates in December despite a “mystery” regarding low inflation. All in all, the pair holds on to the well-known ranges.
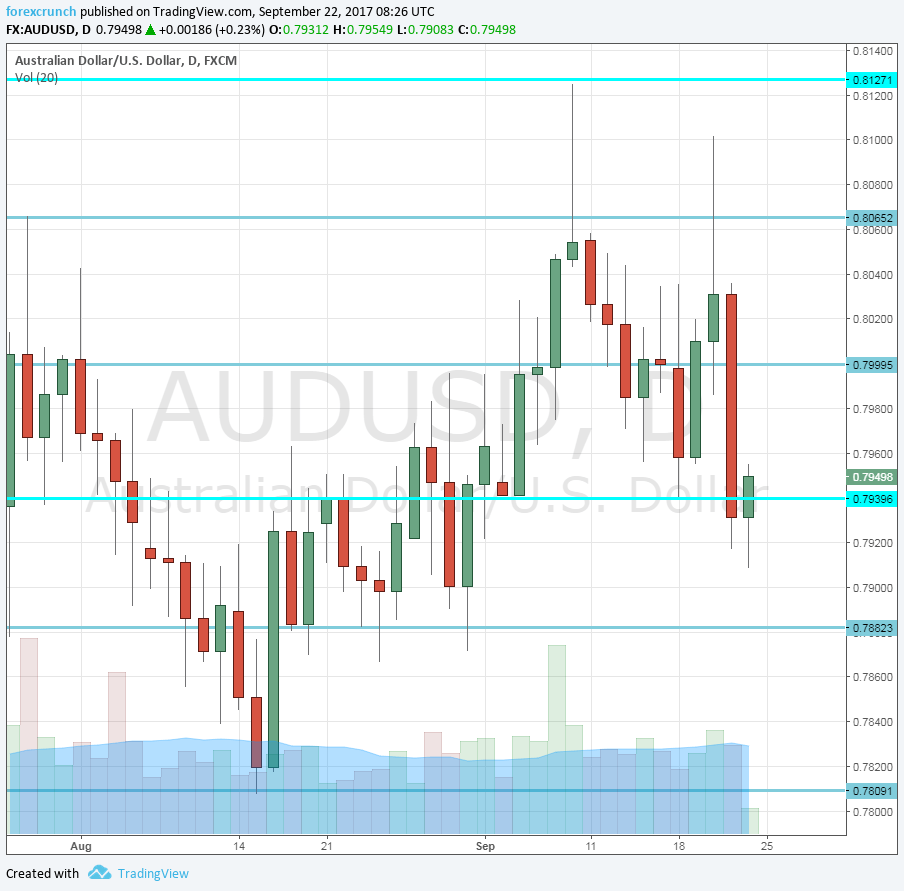
[do action=”autoupdate” tag=”AUDUSDUpdate”/]AUD/USD daily graph with support and resistance lines on it. Click to enlarge:
- Chinese CB Leading Index: Monday, 1:00. This composite index is based on 8 economic indicators that have already been published. Nevertheless, it provides a wide overview. The indicator advanced by 0.9% in July. We now get the figure for August.
- Private Sector Credit: Friday, 1:30. Growth in credit for the private sector implies future growth. Growth levels have been stable at around 0.5% in recent months, the level seen in July. A repeat of the same number is on the cards now..
- Chinese Caixin Manufacturing PMI: Friday, 1:45. This purchasing managers’ index is an independent one and is watched outside China. The recent score of 51.6 in August reflects modest growth. A score of 51.5 is predicted now.
- Chinese official PMIs: Friday, 1:00. The official PMIs from the Chinese government are taken with a grain of salt, but still move markets. The manufacturing PMI stood at 51.7 in August, similar to the independent one. A minor rise to 51.8 is forecast. The non-manufacturing PMI stood at 53.4 points. China is in a transition from industry and investment towards services and consumption.
AUD/USD Technical Analysis
The Australian struggled early in the week and dropped to support at 0.7920, discussed last week. It then turned upwards.
Technical lines from top to bottom:
0.83 was a swing high seen in early 2015 and is our top line. 0.8165 was another swing high, back in May 2015. The new high of 2017 at 0.8125 is becoming interesting as well.
0.8065 is the previous 2017 high. It is followed by the psychological round level of 0.80.
0.7920 was the low point the pair reached after the pair moved to the highs. The round number of 0.7810 provided support in August and replaces the veteran 0.7835 level.
Below, we find 0.7740, that was a high point in June 2017 and also beforehand. 0.7635 was a stepping-stone on the way up, also in June.
Even lower, we find 0.7565 was a low point before the pair shot higher in July. The last line, for now, is 0.7515.
I am neutral on AUD/USD
The dovishness of the RBA could further weigh on the Aussie dollar, balancing out the upbeat economic data. The US dollar rally could reach a halt, but that may not be enough for the pair to advance.
Our latest podcast is titled Fed mysteries and dismissing missiles
Follow us on Sticher or iTunes
Further reading:
- EUR/USD forecast – for everything related to the euro.
- GBP/USD forecast – Pound/dollar predictions
- USD/JPY forecast – projections for dollar/yen
- USD/CAD forecast – Canadian dollar analysis
- Forex weekly forecast – Outlook for the major events of the week.
Safe trading!
