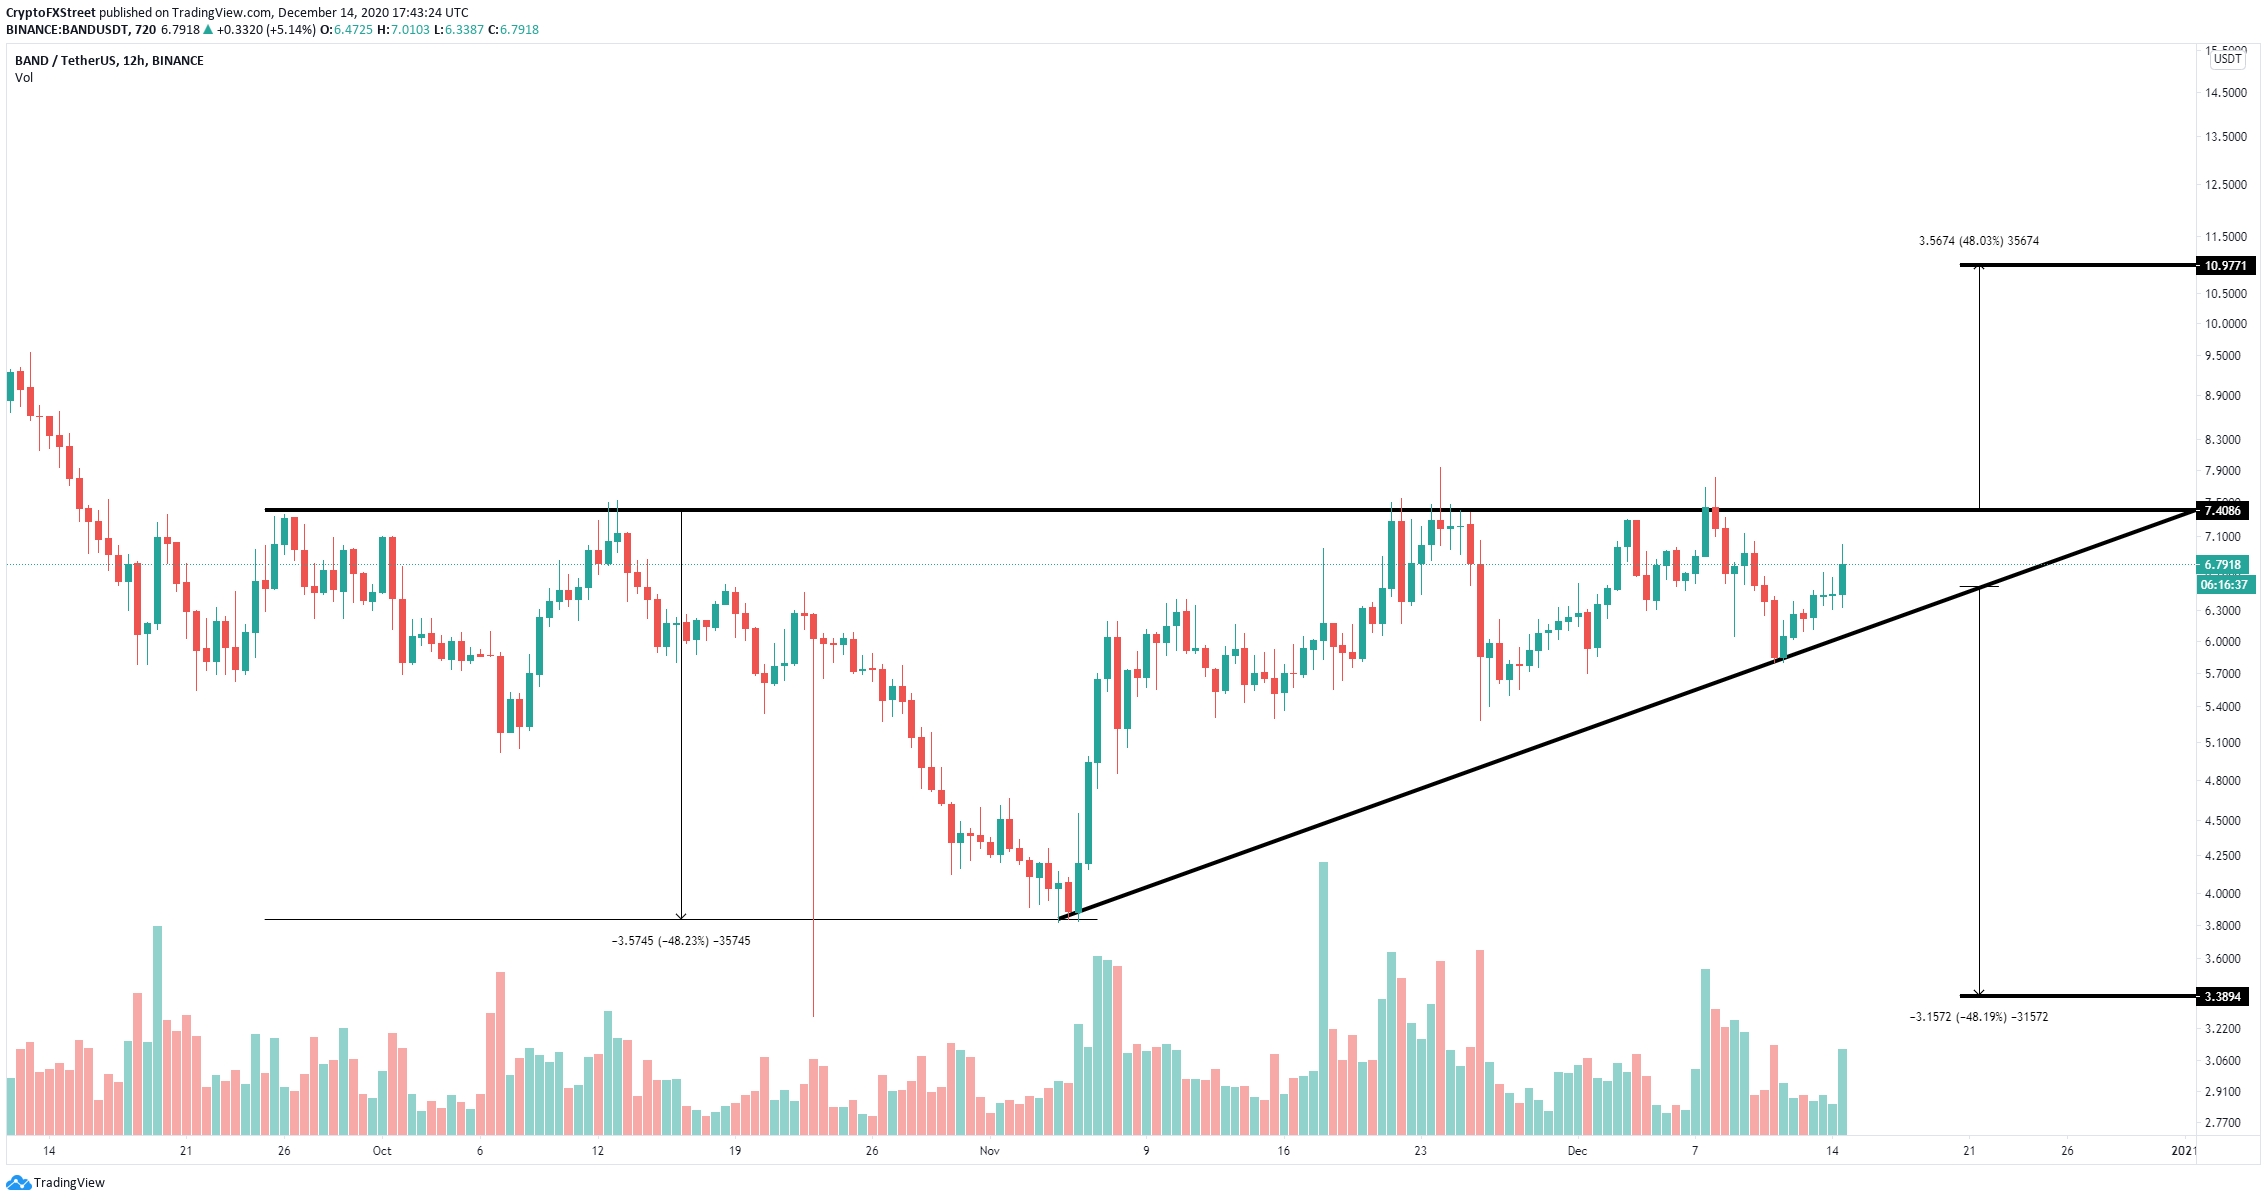
- Band Protocol price is bounded inside an ascending triangle pattern on the 12-hour chart.
- The digital asset is close to a potential breakout or breakdown.
Band Protocol has been trading relatively sideways in the past week awaiting a clear breakout or breakdown from an ascending triangle pattern on the 12-hour chart. The digital asset should see a clear way within the next week.
Band Protocol price in a do-or-die scenario
BAND has established an ascending triangle pattern on the 12-hour chart and it is trading right in the middle of it. The upper trendline resistance level at $7.4 has proven to be a tough bone to chew for the bulls in the past.
BAND/USD 12-hour chart
Currently, Band Protocol price is above the 50-SMA and the 100-SMA, which gives the bulls better odds for a breakout. Cracking the critical resistance level at $7.4 would push BAND towards $11.
On the other hand, a breakdown below the 50-SMA at $6.53 would be a bearish sign with the potential to push BAND towards the lower trendline of the ascending triangle. A breakdown below this point can drive Band Protocol price towards $3.4.

