- BAND seems to have formed an inverse head and shoulders pattern on the 4-hour chart.
- Bulls are eying up a potential price target at $10.
BAND is currently trading at $6.15, losing around 65% of its value since the peak at $17.97 on August 10. Nonetheless, the digital asset still holds a $126 million market capitalization and shows signs of a potential bullish reversal.
BAND aiming for a reversal, according to several indicators
Overall, it seems that the entire cryptocurrency market is turning bullish despite the recent FUD from various exchanges. Willy Woo, an expert in on-chain metrics, has posted a Tweet stating that the last announcement about OKEx locking withdrawals didn’t affect the market, which indicates we are in bull season.
BAND/USD 4-hour chart
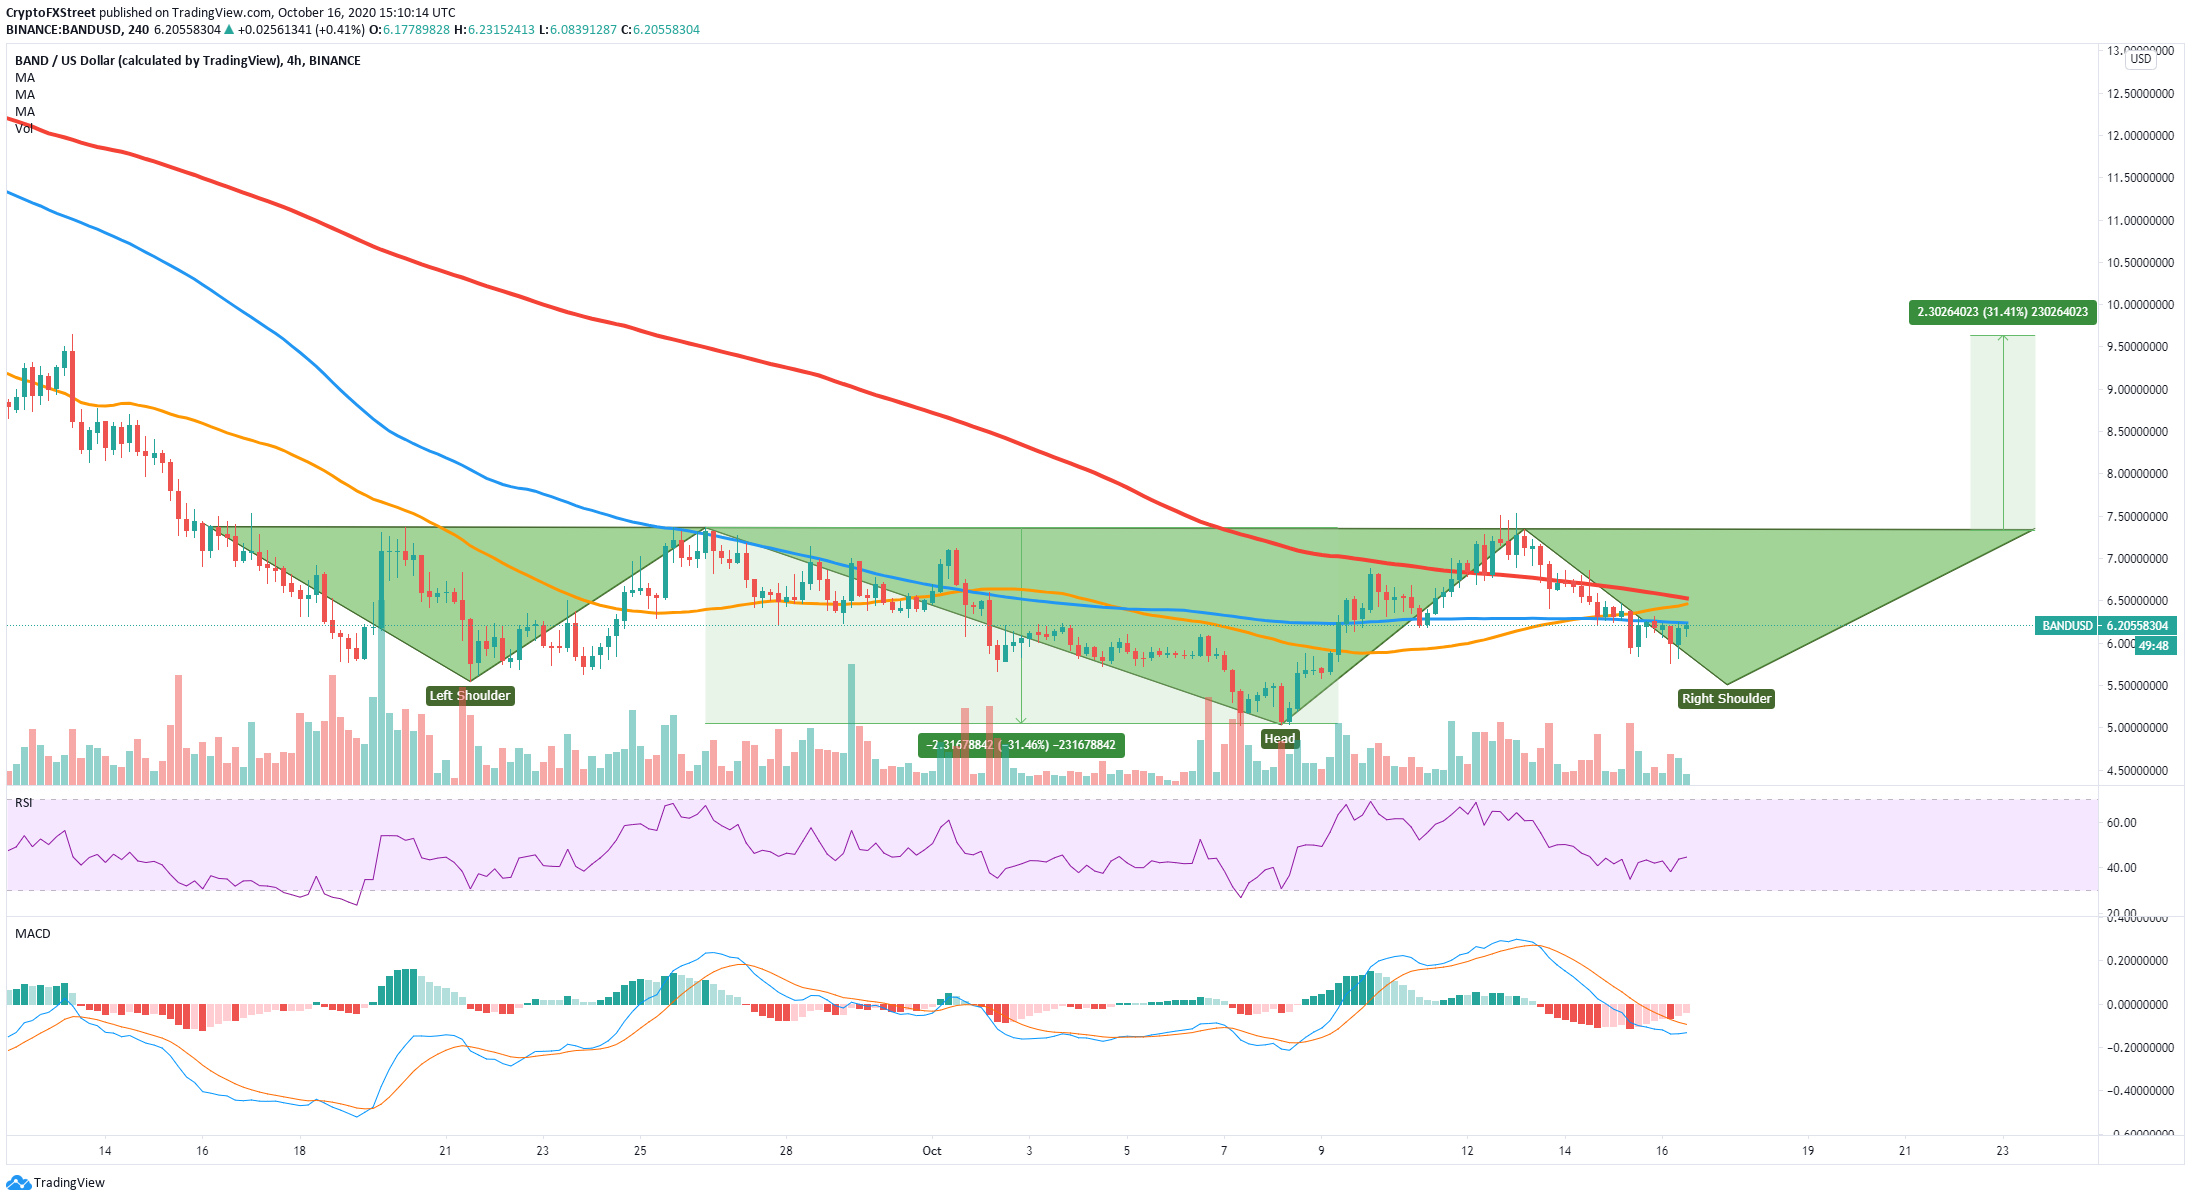
It looks like BAND could be forming the right shoulder of the inverse head and shoulders pattern. The most critical resistance level is $7.33, a bullish breakout above this level can potentially drive the price towards $10, using the length of the head of the pattern.
BAND IOMAP Chart
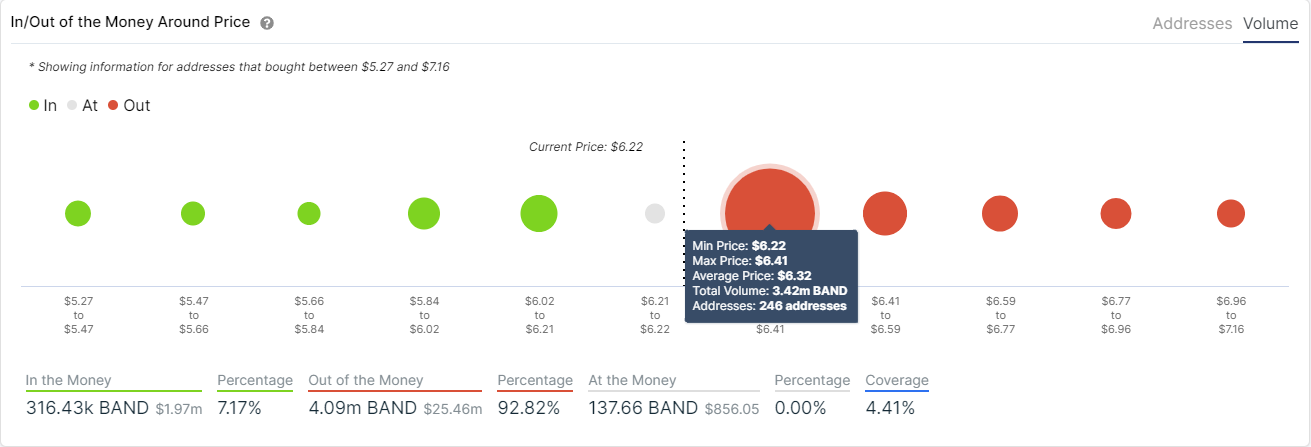
The MACD is slowly turning bullish, and the In/Out of the Money Around Price chart shows there is only one significant resistance area between $6.22 and $6.41, with 3.42 million BAND in volume. Above this point, the resistance is notably low in comparison, which means an initial breakout above $6.41 can push BAND to the $7.33 resistance.
BAND/USD 1-hour chart
-637384581111545536.png)
On the other hand, although the inverse head and shoulders pattern has potential, BAND faces several technical resistance levels. On the 1-hour chart, the 50-SMA is currently acting as a strong resistance point. The 200-SMA and the 100-SMA will also pose a threat to the bulls.
Additionally, observing the same IOMAP chart as above, we can notice a lack of support on the way down. A failure to hold the support level at $5.5 where the right shoulder is located, would most likely drive BAND towards the low of $5 and possibly even lower.
Crucial price points for investors
A bullish inverse head and shoulders pattern formed on the 4-hour chart signifies a potential reversal for BAND. A breakout above $6.41 can push BAND towards the baseline of the pattern at $7.33. Climbing above this point can lead the digital asset to $10.
Despite the bullish pattern, BAND seems to be facing several important resistance levels on the way up. A failure to hold the most critical support level established at $5.5 can easily take the digital asset down to the low of $5 and potentially even lower.
