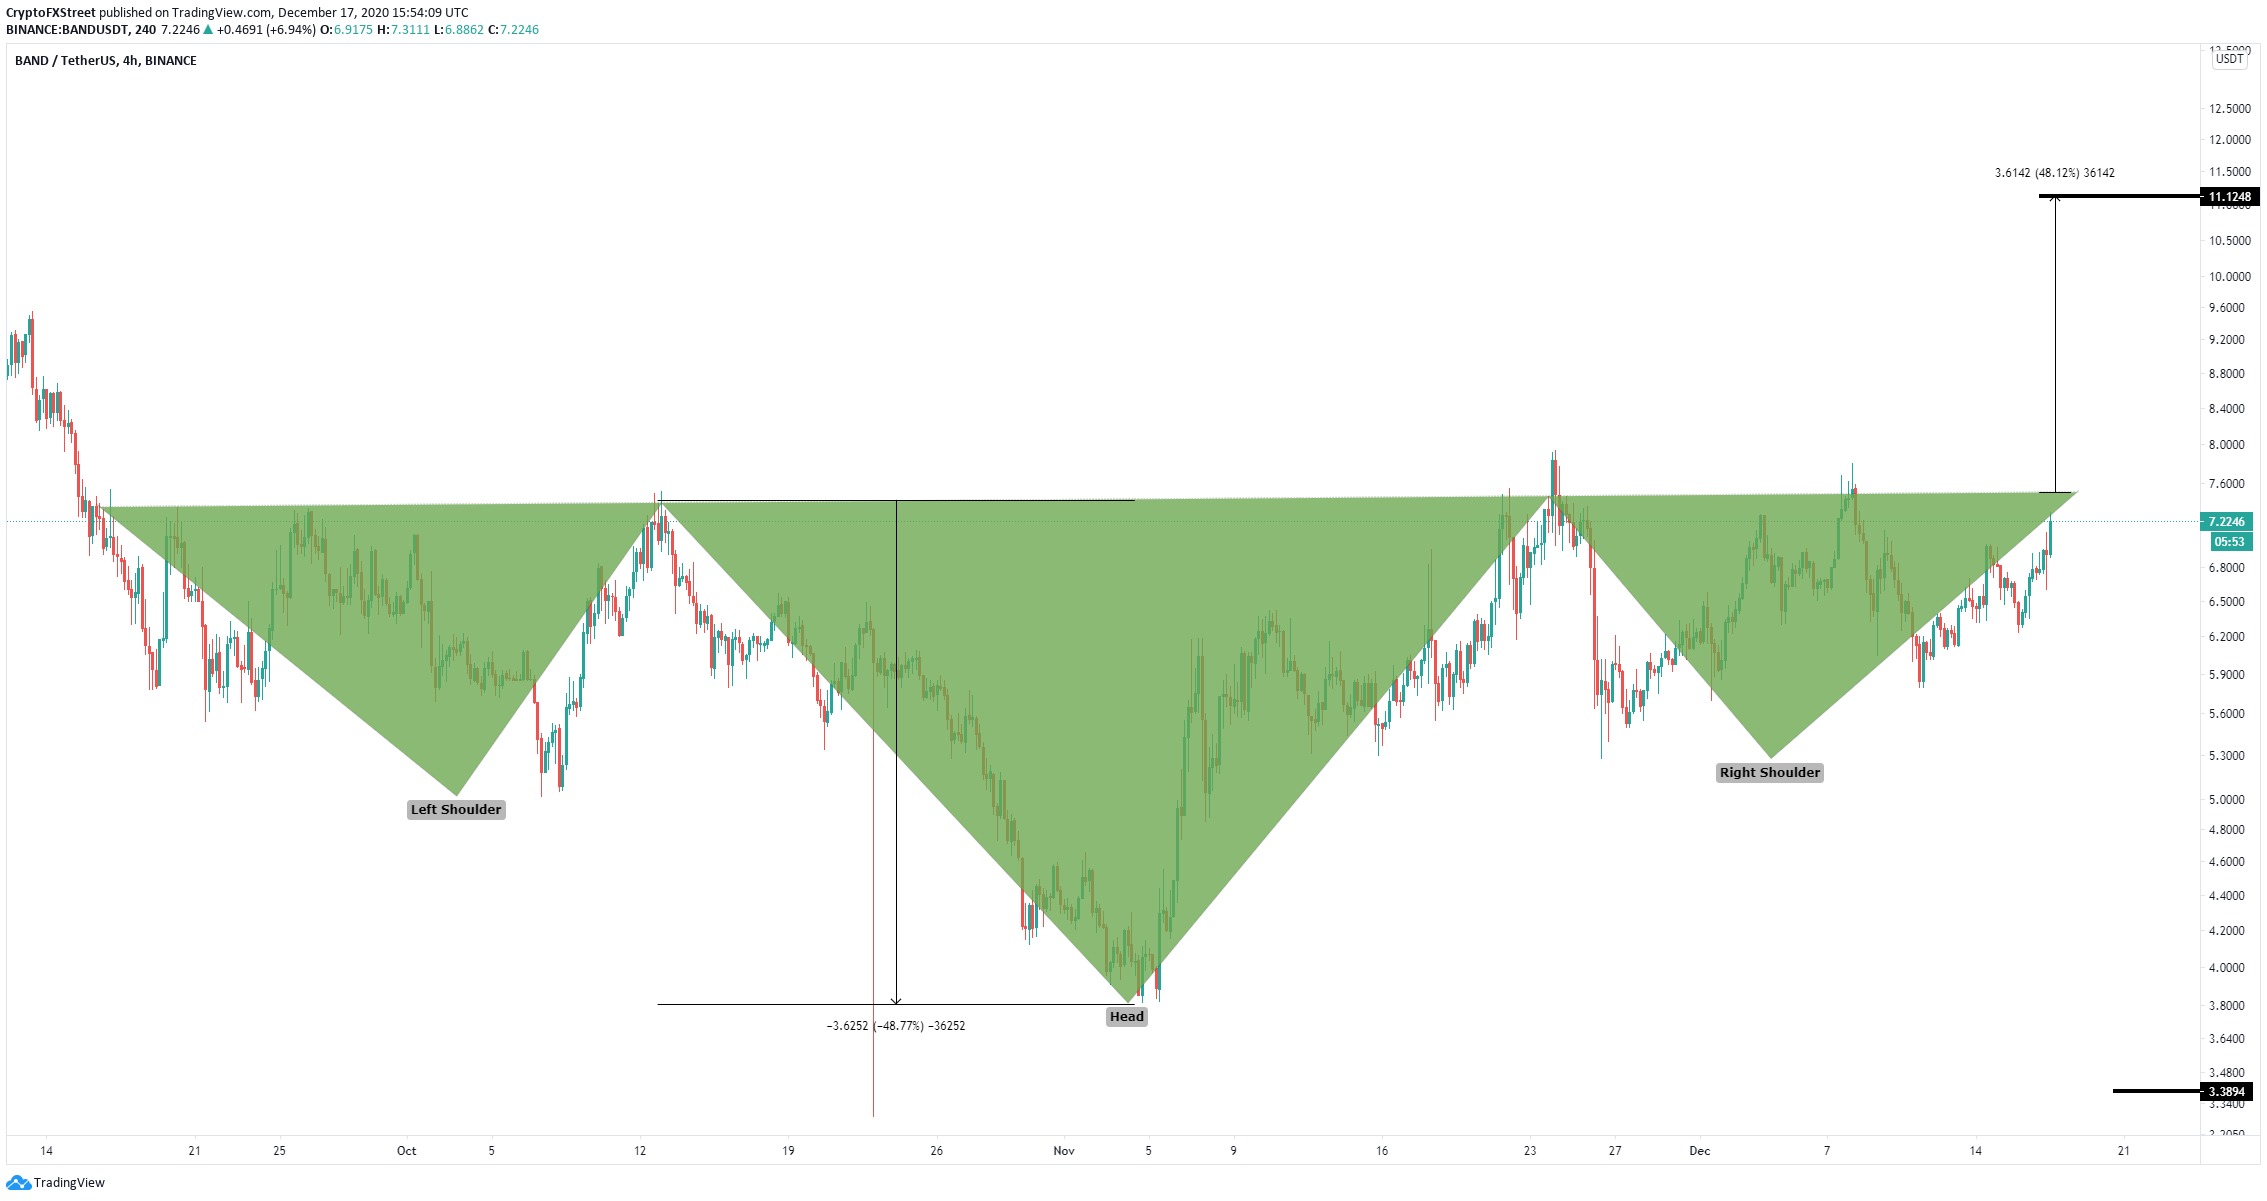
- Band Protocol price seems to be bounded inside an inverse head and shoulders pattern.
- There is only one crucial resistance level separating BAND from a massive breakout.
BAND has been trading inside a price range between $8 and $5 for the past three weeks and seems to be on the verge of a massive breakout. The digital asset faces a critical resistance level at $7.5.
Band Protocol price should benefit from the market’s bullishness
Bitcoin price reached a new all-time high and several cryptocurrencies are trying to follow it. Band Protocol price is contained inside an inverse head and shoulders pattern on the 4-hour chart.
BAND/USD 4-hour chart
The neckline resistance level is established at $7.5. A breakout above this point can quickly push Band Protocol price above $8 towards a target of $11 in the long-term.
BAND IOMAP chart
Furthermore, it seems that the In/Out of the Money Around Price (IOMAP) chart shows practically no resistance ahead of $7 which gives even more credence to the bullish outlook.
However, a rejection from the critical level at $7.5 would be a bearish sign which can potentially push Band Protocol price towards the next support level at $6.6. A breakdown below this point would drive the digital asset to a low of $5.8.

-637438175173319654.png)
