BCH/USD daily chart
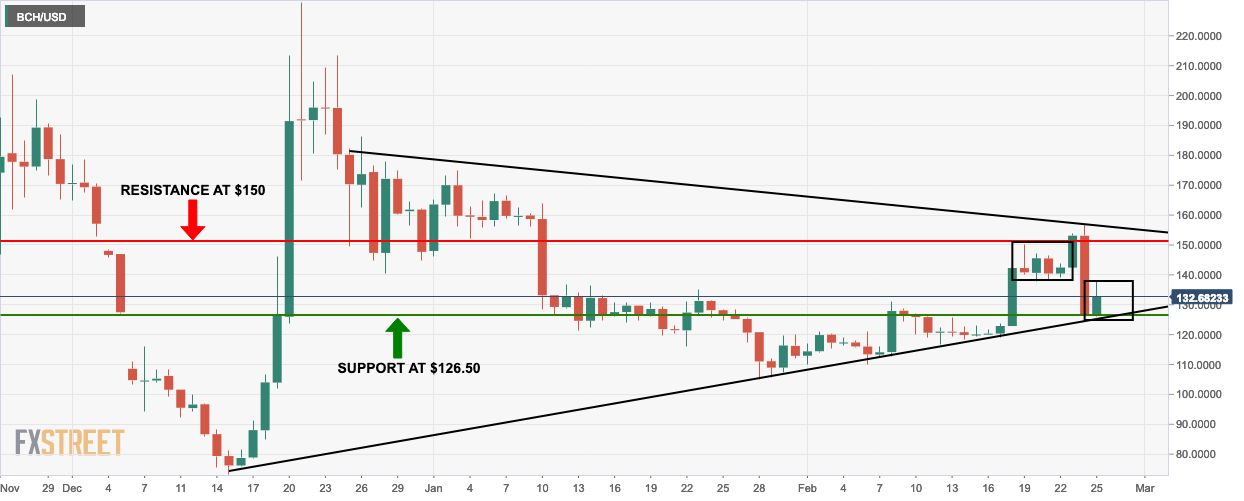
- BCH/USD market finds support at $126.50 as price falters at $150 level.
- Market forms bearish flag and it is prime for a breakout.
BCH/USD 4-hour chart
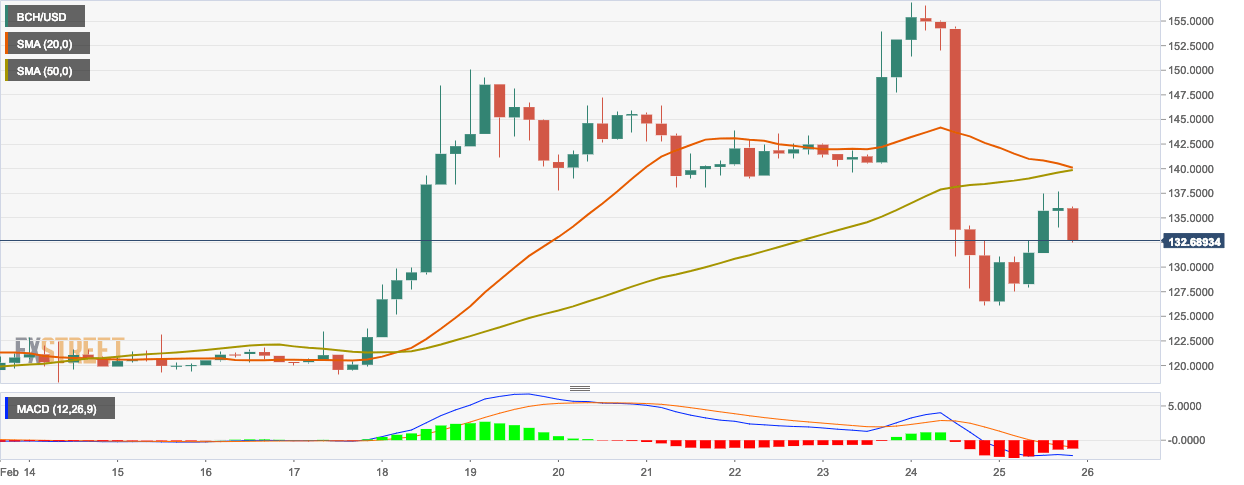
- The moving average convergence/divergence (MACD) shows a decreasing bearish momentum.
- The 20-day simple moving (SMA 20) curve is about to cross below the SMA 50 curve which is a sell signal.
BCH/USD hourly chart
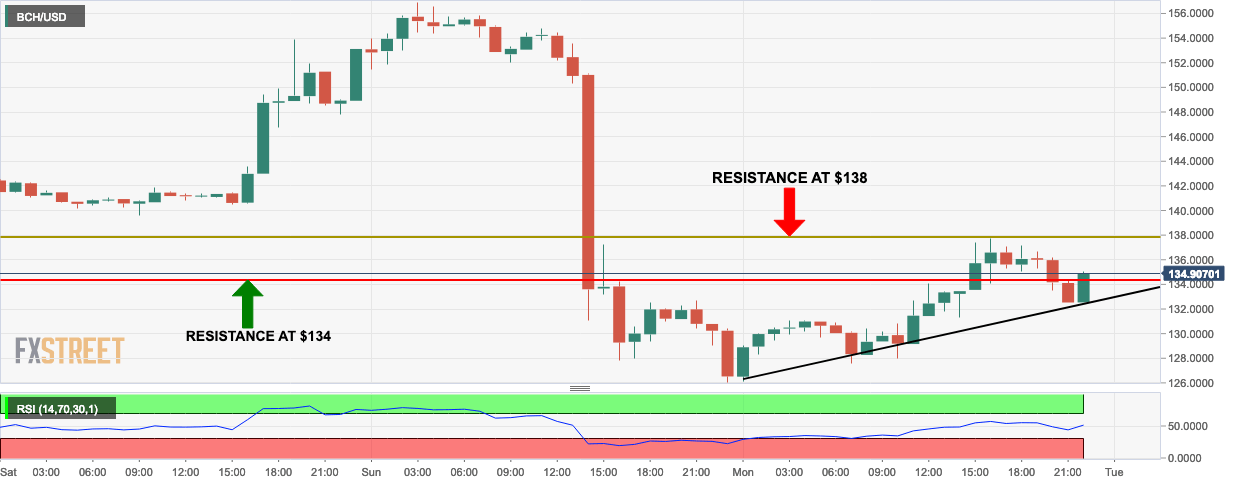
- On the hourly chart, bulls see short-term resistance at $134 as the price sees a slight breakout from triangle formation.
- The relative strength index (RSI) curve is trending in the neutral territory.
Key Levels
- Resistance 3: $177.8072
- Resistance 2: $167.3703
- Resistance 1: $146.9466
- Pivot Point: $136.5097
- Support 1: $116.0860
- Support 2: $105.6491
- Support 3: $85.2253
