- Bitcoin Cash has broken 300 to the upside and is up 3.5% for the session.
- A key trendline has been broken which originated on 26th June.
Bitcoin Cash is moving higher today and has broken the 300 psychological level to the upside.
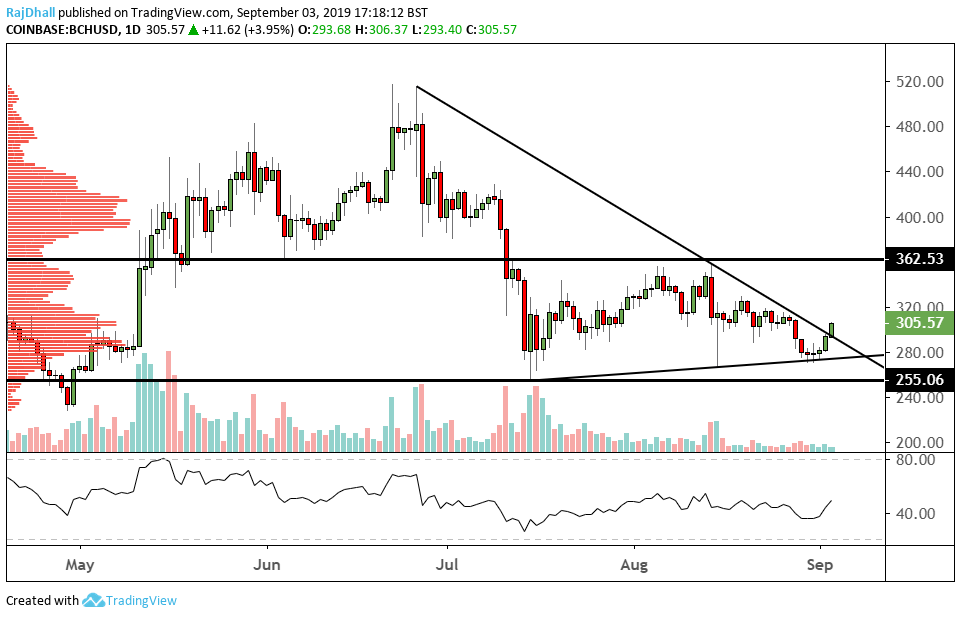
On the technical front, the daily candlestick chart above shows a Marubozu close indicating more bullish price action.
Having said that BCH/USD is not out of the woods the chart above shows a serious consolidation phase with strong levels between 255 and 362.
In terms of resistance levels, 326 could halt the uptrend and the stronger 370 beyond that. The main support is 270 and if that breaks BCH/USD will make a lower high lower low formation.
Looking at the volume histogram at the bottom of the chart it showing a distinct lack of volume on the Coinbase exchange. If a rally to the upside is to be continued you would want some more backing from the market.
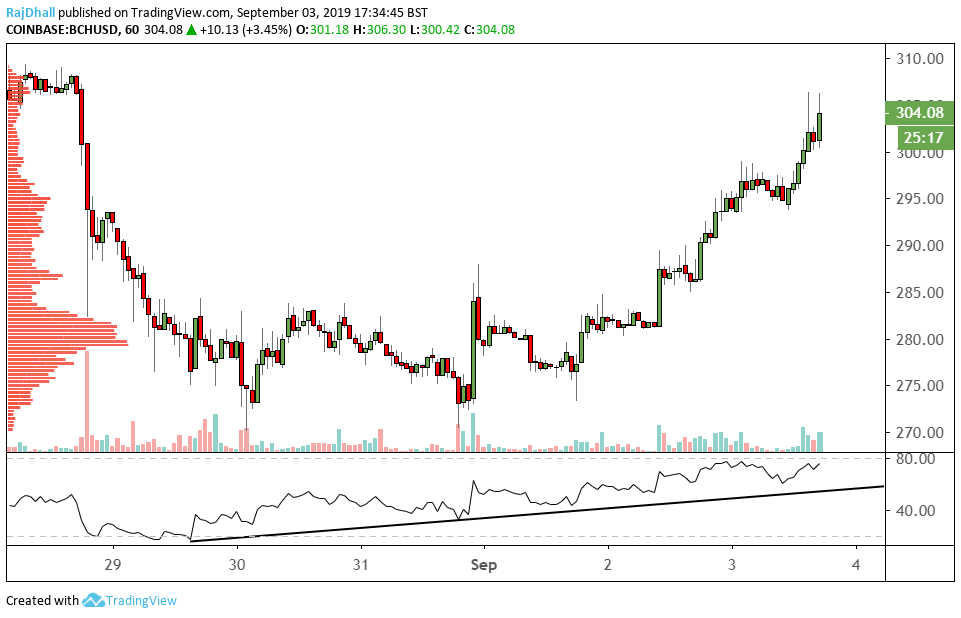
The 1-hour chart below is showing that momentum might slow down as the RSI wave made a lower high while price made a higher high.
On the downside, if the trendline break on the RSI chart that could indicate a retracement is in the making.