- Binance Coin price is up 45% since the breakout from a symmetrical triangle pattern.
- BNB firmly positioned as the third-largest cryptocurrency by market capitalization.
- Pattern measured move target is $418.30.
Binance Coin price is printing new all-time highs today, carrying on the impressive rally of 45% from the symmetrical triangle breakout on March 30. The advance’s strength has already lifted BNB close to the measured move target of $418.30. Still, the lack of volume should caution traders looking for a continuation of the rally to the key Fibonacci extension levels.
Binance Coin price clears the psychologically important $400
The rise of BNB has woken the cryptocurrency whales as they have started moving the altcoin in significant sums. For example, Whale Alert, a cryptocurrency analytics firm, reported a transaction of $5.72 million yesterday that involved the transfer of 16,500 BNB from the Binance exchange to FTX exchange.
The growing value of BNB can be attributed to the fact that Binance users can pay trading fees with their coin at a lower cost and can stake BNB by way of the Binance Launchpool to earn rewards and participate in new listings. Moreover, Binance recently introduced Binance Pay and Binance Card.
BNB has reached an inflection point in the short-term that projects a consolidation for the digital currency. The consolidation is not anticipated to be deep, but more of a correction in time versus price.
If BNB does race through the measured move target of $418.30 on a daily closing basis, it does raise the odds that it will test the 1.382 Fibonacci extension at $469.86, followed by the 1.618 extension at $546.16.
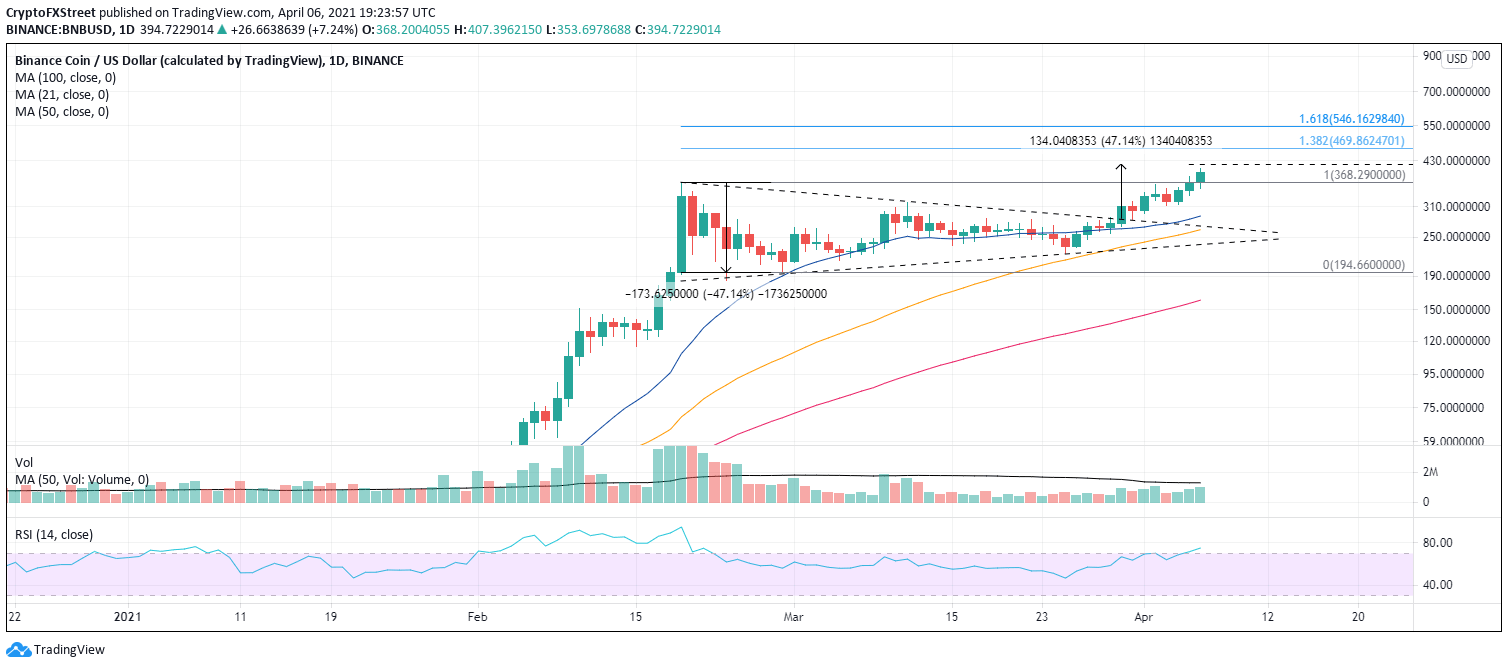
BNB/USD daily chart
Support begins at the all-time high at $368.29, and it should be a magnet during the consolidation. A deeper correction will first locate support at the 21-day simple moving average (SMA) at $110.06, then the declining trend line of the symmetrical triangle pattern at $270.00, followed by the 50-day SMA at $264.06.
