- Bitcoin may be vulnerable to massive losses as $8,000 gives way once again.
- Critical support is created by SMA100 on a weekly chart.
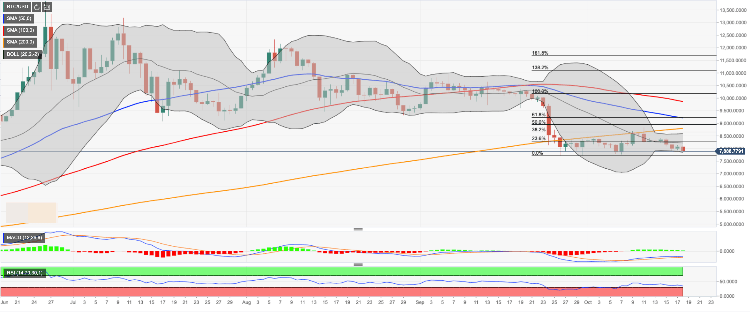
Bitcoin (BTC) bulls attempted a recovery but failed to hold the ground above $8,000. A strong sell-off during early Asian hours took the price below the pivotal handle towards the intraday low of $7,869. BTC/USD is changing hands at $7,900, down over 2% since the beginning of the day. The downside momentum may gain traction if the price does not rerun above $8,000 in the nearest future.
Looking technically, the next strong support is created by the lower line of the Bollinger Band on a daily chart at %7,840. Once it is out of the way, the sell-off is likely to continue with the next bearish target at $7,800-7,780 (SMA100 (Simple Moving Average) on a weekly chart). This is strong support that has stopped the downside on several occasions since the end of September. A sustainable move below this area will push BTC from the cliff to $7,400 ( the lower line of the Bollinger Band on a weekly chart).
On the upside, we will need to see a sustainable move above $8,100 to mitigate an initial bearish pressure and allow for an extended recovery towards the middle line of the daily Bollinger Band at $8,200 and this week’s high at $8,400.
BTC/USD, the daily chart