- Bitcoin was seen nursing minor losses on Friday around 0.8%, in the latter stages of the session.
- BTC/USD produced a bearish close candlestick on Wednesday, which has consequently seen the market edging lower.
- Bitcoin is heading for its third consecutive session in the red, following the indications of a reversal.
BTC/USD daily chart
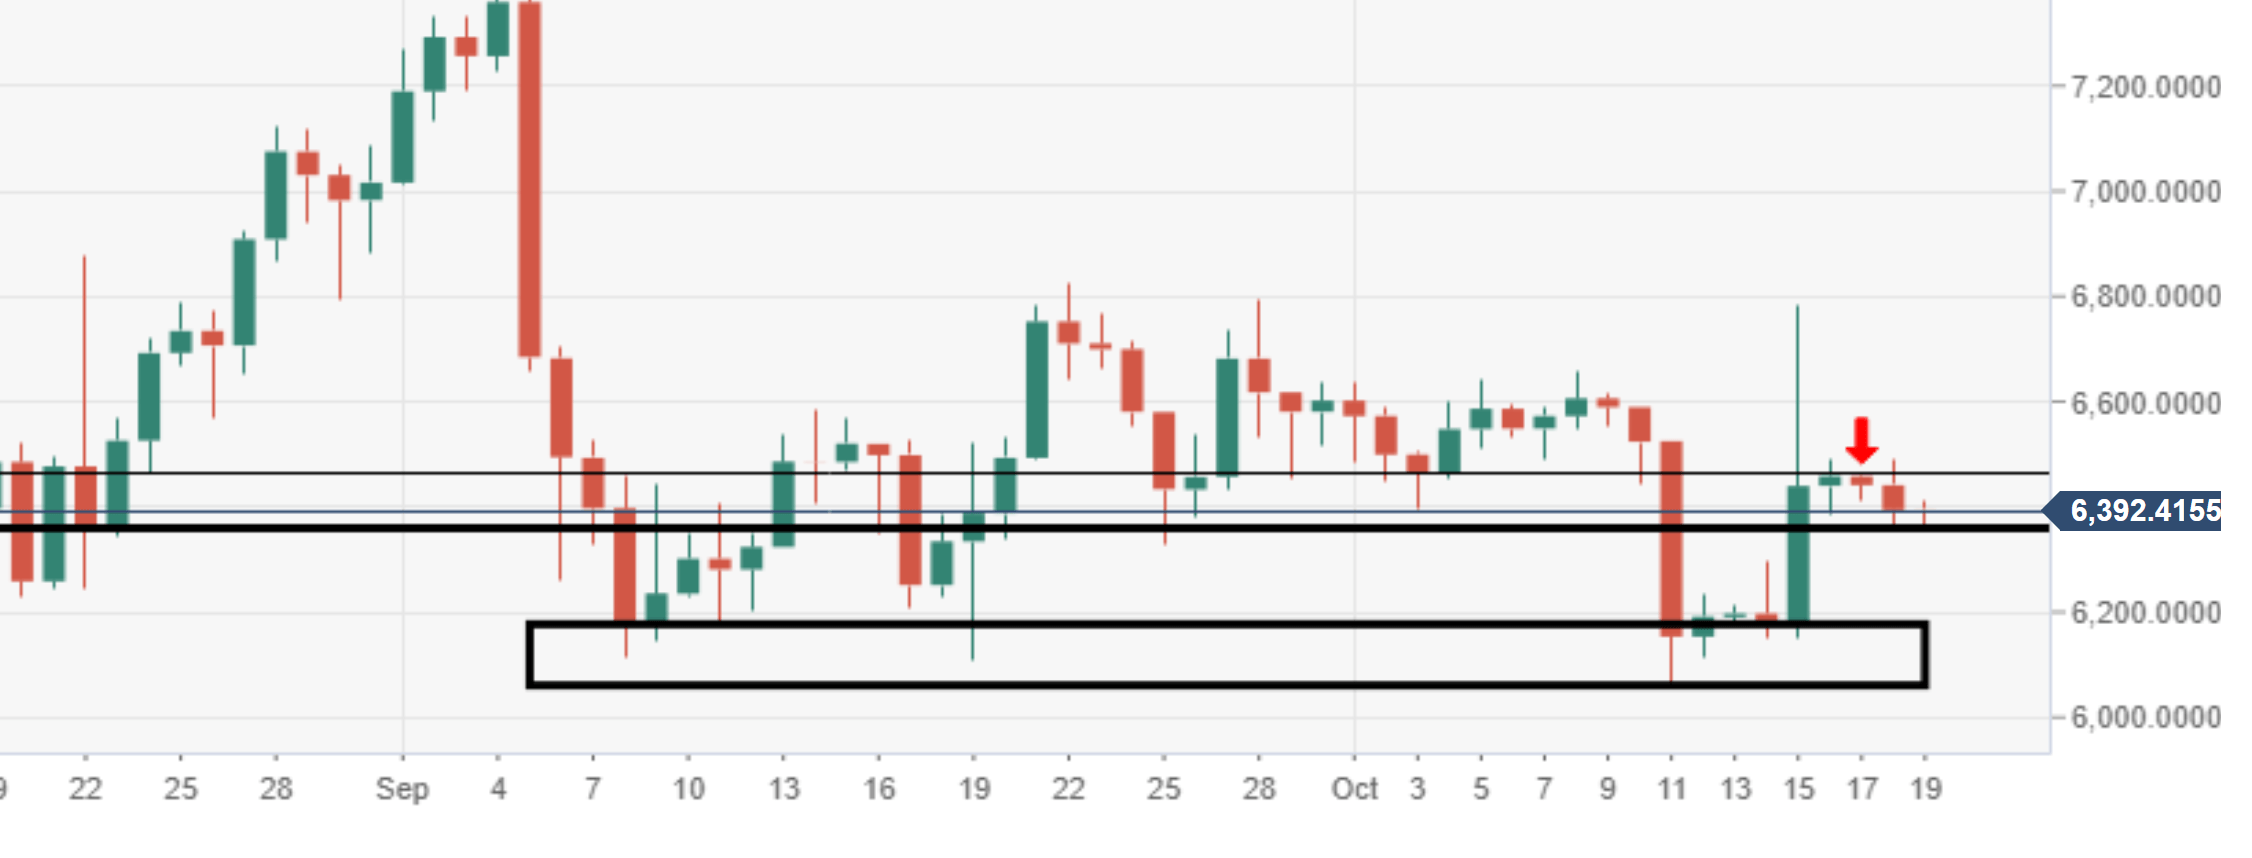
Spot rate: 6392.4
Relative change: -0.80%
High: 6414.0
Low: 6312.5
Trend: Bearish
Support 1: 6362.0, daily support.
Support 2: 6180.5, demand zone.
Support 3: 6090.0, 11 October low.
Resistance 1: 6492.8, resistance on daily.
Resistance 2: 6500-6600.0, supply area.
Resistance 3: 6800.0, top area 22-28 September & 15 October.
