- BCH has been previously trending in a $10-range between $221.20 to $231.
- BCH must now get over strong resistance between $236.58 and $243.20
After trending in a narrow $10-range between $221.20 to $231, the bulls were finally able to push above the $231 resistance line. Currently, the buyers aim to take BCH/USD to $243.85 to break above the SMA 20 curve. The recent bullish price action has jumped the RSI from the edge of the oversold zone to 50. What this means is that there is more space for buyers to push the price up.
BCH/USD daily
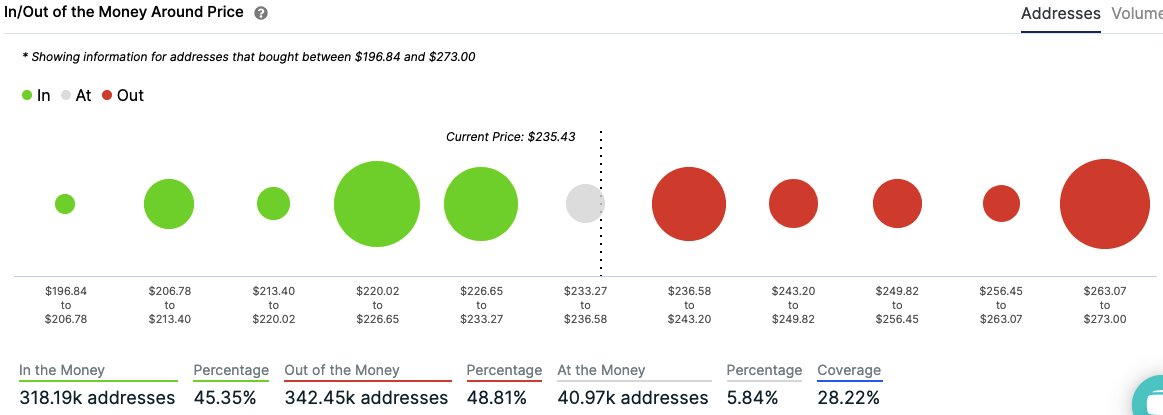
BCH/USD IOMAP
However, to enjoy any more bullish movement, BCH has to somehow get over strong resistance between $236.58 and $243.20. If they do manage to do that, then the price should be able to go up to $273, where it encounters the next strong resistance level.
On the flip side, if the price does fail to encounter the initial resistance, there is a moderate-to-strong support zone between $226.65 to $233.27.
Key levels
-637357378224546653.png)

