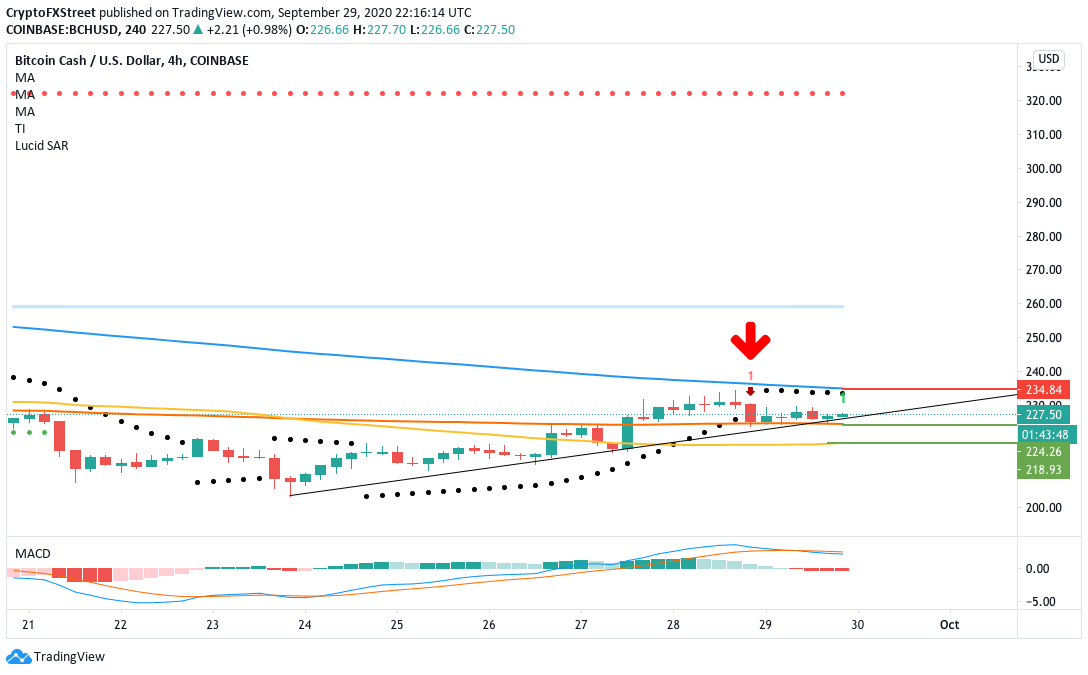
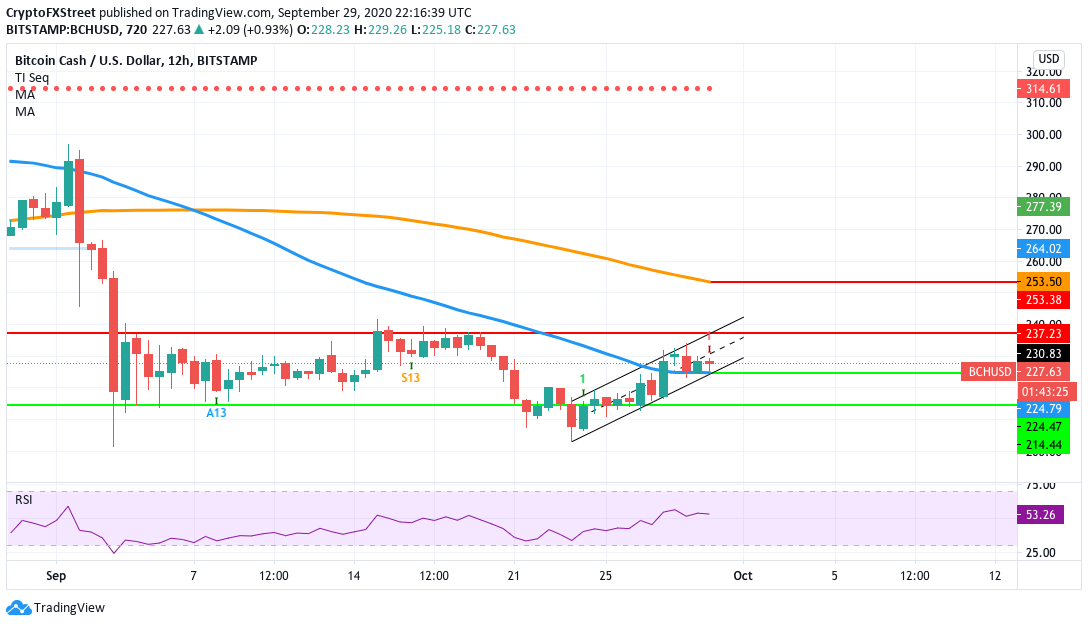
The parabolic SAR has reversed from bullish to bearish in the 4-hour chart. The IOMAP shows that the price is currently sitting on top of a healthy support wall. The BCH 4-hour chart flashed a sell sign in the TD sequential indicator. After flashing the signal, the price has been trending horizontally over the next six sessions. BCH needs to break below the upward trending line and the SMA 200 ($224.25) to validate that sell signal and strengthen the downtrend. The parabolic SAR and MACD are both bearish, which shows that the price should ideally break below this period of consolidation. However, why is the price consolidating in the first place instead of going down? For that, we need to look at the IOMAP. BCH IOMAP IntoTheBlock’s “Daily Active Addresses” model shows us that BTC is presently sitting on top of a strong support wall at $223. At this level, around 106,810 addresses had previously purchased 816,280 BCH. As per the IOMAP, this support wall absorbs a lot of the selling pressure, which is preventing the downward trend, for now. However, if the sellers do break below this level, they may have enough momentum to take the price below $200. On the upside, we have a moderate-to-strong resistance level, $233. In this level, 96,400 addresses had bought 594,000 BCH. BCH 12-hour chart The 12-hour chart helps us gain a better understanding of the potential price action. The latest candlestick has also flashed a sell signal in the TD sequential indicator. To solidify this downtrend, the price must break below the SMA 50 ($224) to have a bearish breakout from the flag formation. Following this, the price will probably drop down to the $214.45 support level. The relative strength index (RSI) is trending around the neutral zone, which shows that the sellers have plenty of room to move before the asset becomes undervalued. BCH Key levels FX Street FX Street FXStreet is the leading independent portal dedicated to the Foreign Exchange (Forex) market. It was launched in 2000 and the portal has always been proud of their unyielding commitment to provide objective and unbiased information, to enable their users to take better and more confident decisions. View All Post By FX Street Crypto News share Read Next USD/CAD Price Analysis: Seesaws inside ascending triangle below 1.3400 FX Street 2 years The parabolic SAR has reversed from bullish to bearish in the 4-hour chart. The IOMAP shows that the price is currently sitting on top of a healthy support wall. The BCH 4-hour chart flashed a sell sign in the TD sequential indicator. After flashing the signal, the price has been trending horizontally over the next six sessions. BCH needs to break below the upward trending line and the SMA 200 ($224.25) to validate that sell signal and strengthen the downtrend. The parabolic SAR and MACD are both bearish, which shows that the price should ideally break below this period of… Regulated Forex Brokers All Brokers Sponsored Brokers Broker Benefits Min Deposit Score Visit Broker 1 $100T&Cs Apply 0% Commission and No stamp DutyRegulated by US,UK & International StockCopy Successfull Traders 9.8 Visit Site FreeBets Reviews$100Your capital is at risk. 2 T&Cs Apply 9.8 Visit Site FreeBets Reviews$100Your capital is at risk. 3 Recommended Broker $100T&Cs Apply No deposit or withdrawal feesTrade major forex pairs such as EUR/USD with leverage up to 30:1 and tight spreads of 0.9 pips Low $100 minimum deposit to open a trading account 9 Visit Site FreeBets ReviewsYour capital is at risk. 4 T&Cs Apply Visit Site FreeBets ReviewsYour capital is at risk. 5 Recommended Broker $0T&Cs Apply Trade gold, silver, and platinum directly against major currenciesUp to 1:500 leverage for forex trading24/5 customer service by phone and email 9 Visit Site FreeBets ReviewsYour capital is at risk.