- Bitcoin Cash price is trading in the red, with losses of 2.00% in the second half of the session.
- BCH/USD is narrowing within a bearish pennant structure via the daily.
- The price is at risk of testing the $100 mark to the downside.
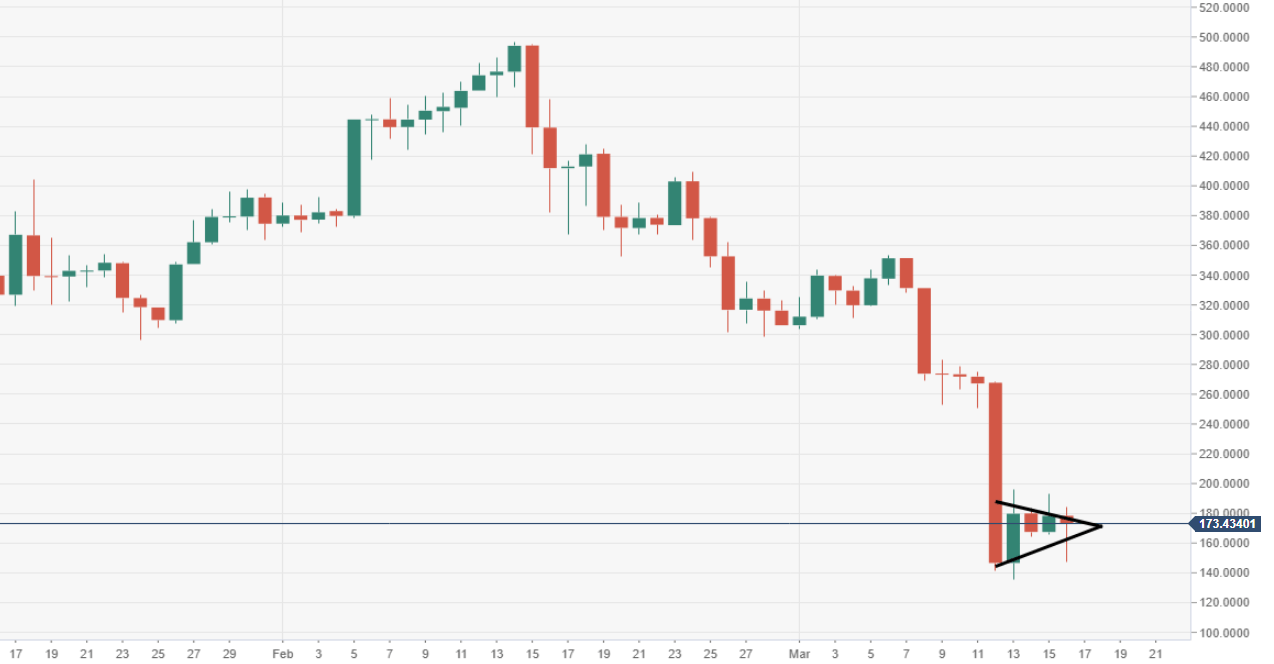
BCH/USD daily chart
Price action remains tight with growing risks of a breakout from a bearish pennant pattern. The lower acting support is tracking at $160, a breach could pave the way for $100.
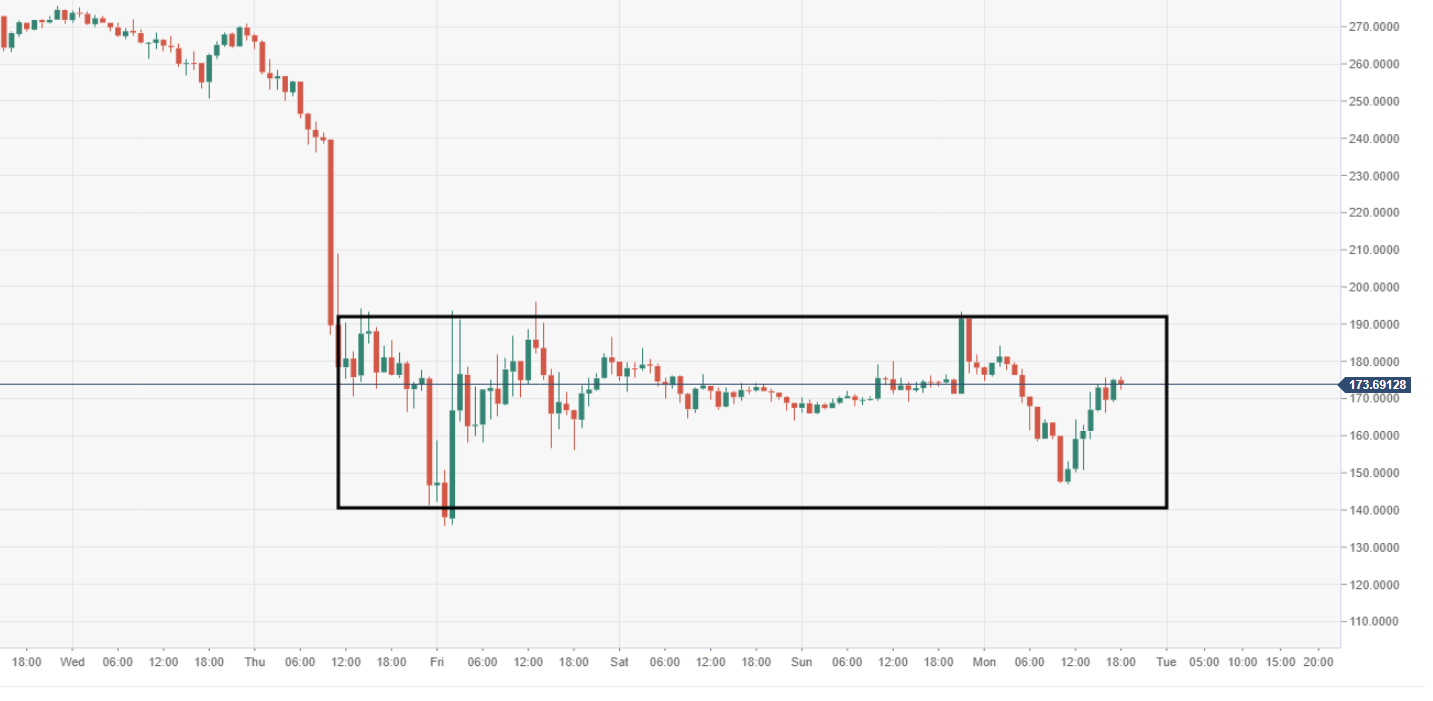
BCH/USD 60-minute chart
A narrowing range-block should be noted via the 60-minute chart view, subject to a breakout. The upper part of the range tracks at $195, with the lower support at $140.
Spot rate: 174.50
Relative change: -2.50%
High: 184.21
Low: 147.06
