- Bitcoin Cash price is trading in the red, with losses of 4.00% in the second half of the session.
- BCH/USD has managed to extend north since the critical $300 price retest.
- The bulls have made way for a near-term recovery, after bottoming out the last few days.
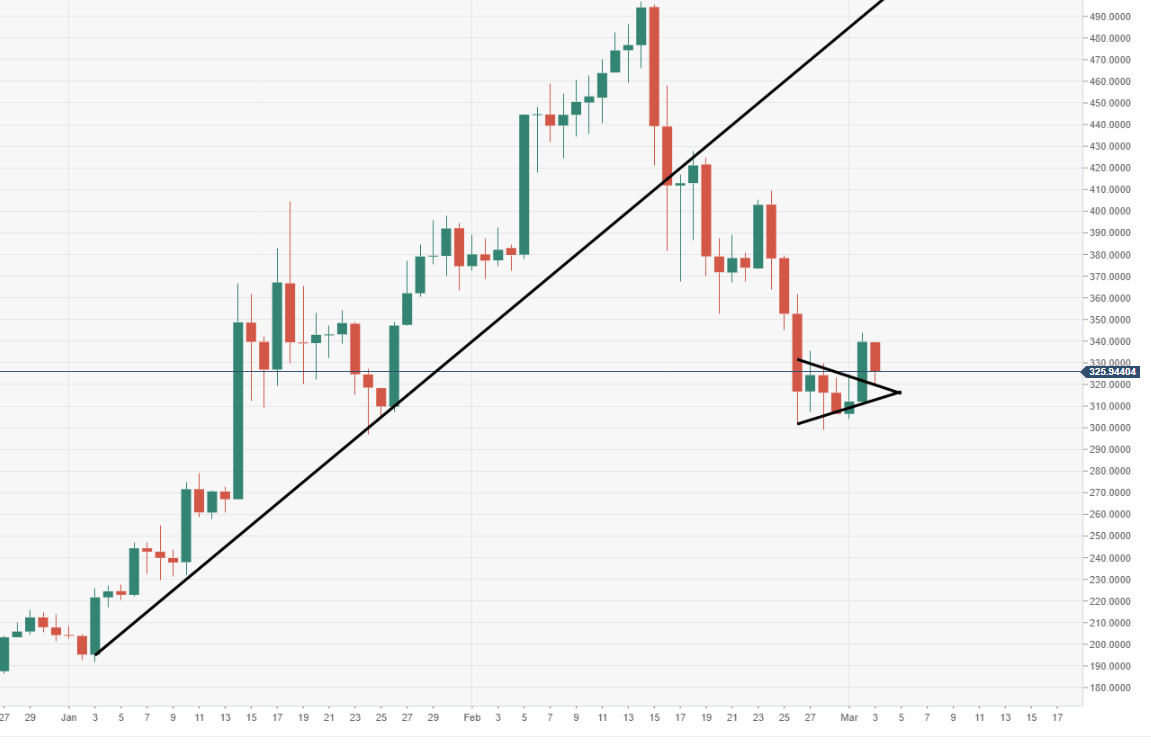
BCH/USD daily chart
The price had been moving within a narrowing pennant structure, from 27 February to 1 March. However, the bull forced a decent daily breakout in the session of 2 March and closing above, voiding the pattern for now.
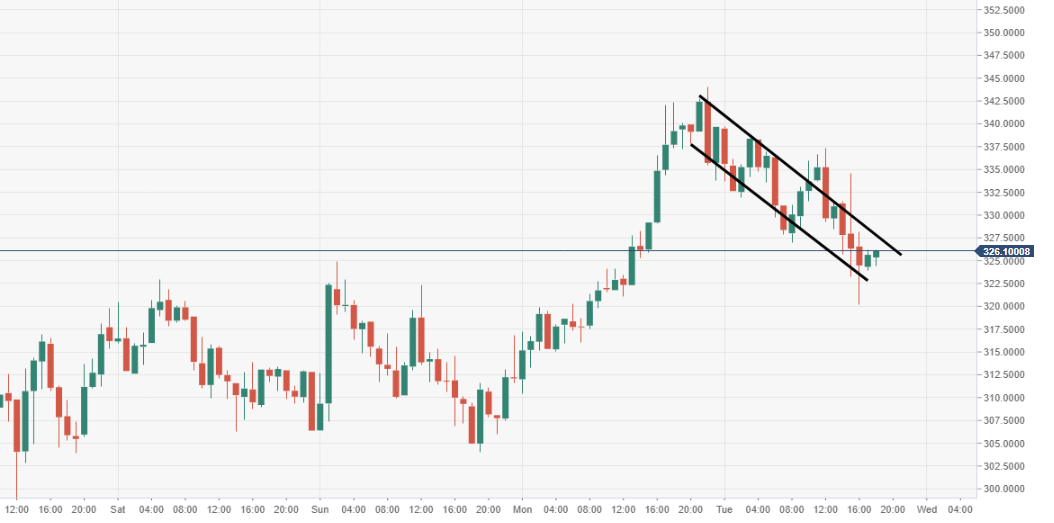
BCH/USD 60-minute chart
Bulls have extended to the upside out from a bullish flag structure, inviting a decent wave of pressure north.
Spot rate: 328.46
Relative change: -4.00%
High: 339.74
Low: 320.14
