- Bitcoin Cash price is trading in the green, with gains of 2.85% in the second half of the session.
- BCH/USD has broken above daily resistance seen at $325, prior acting support. m
- The bulls are gunning for a retest of the high area seen last week.
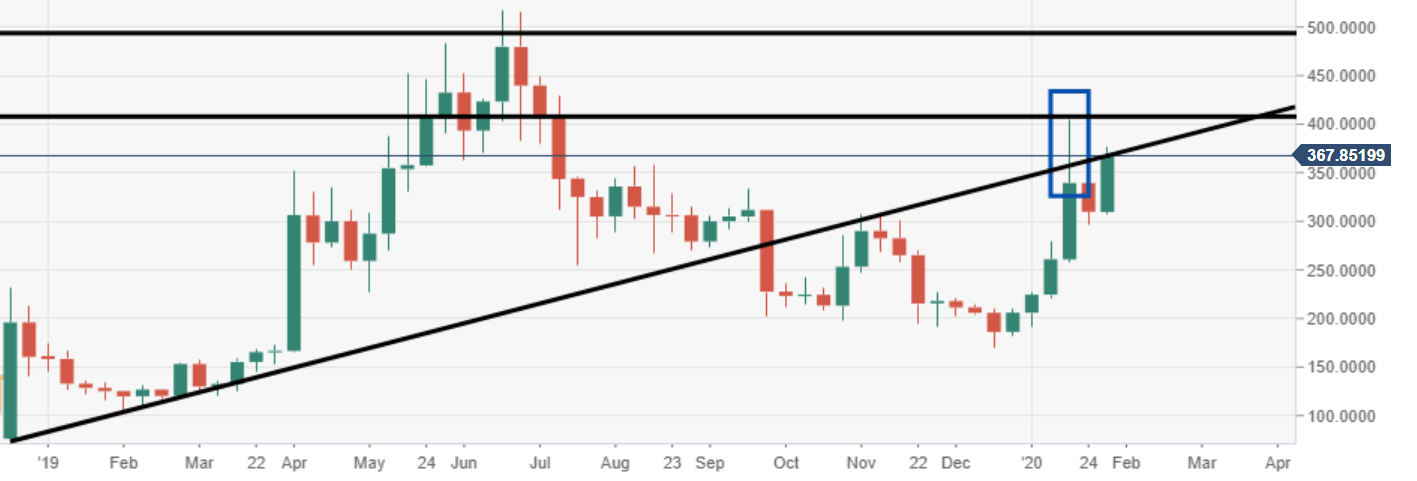
BCH/USD weekly chart
Bulls are hunting for a candlewick fill from the week of 17 January. Eyes would then be on the $500 price mark.
BCH/USD daily chart
The price via the daily is extending to the north, running at two sessions in the green. Price action broke out of a flag formation.
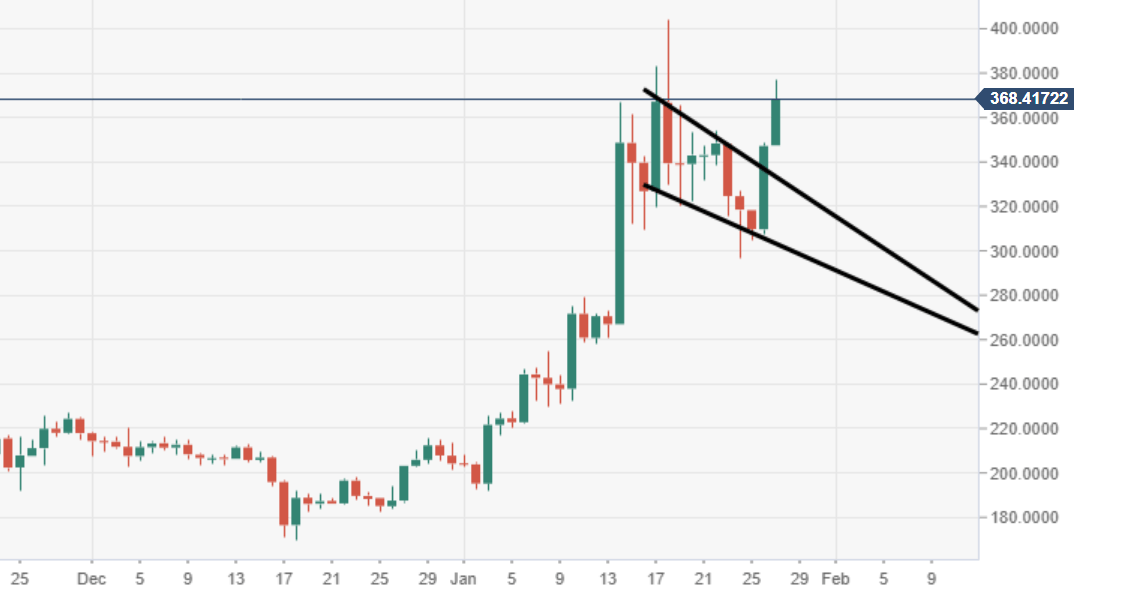
Spot rate: 368.09
Relative change: +6.00%
High: 376.99
Low: 347.08
